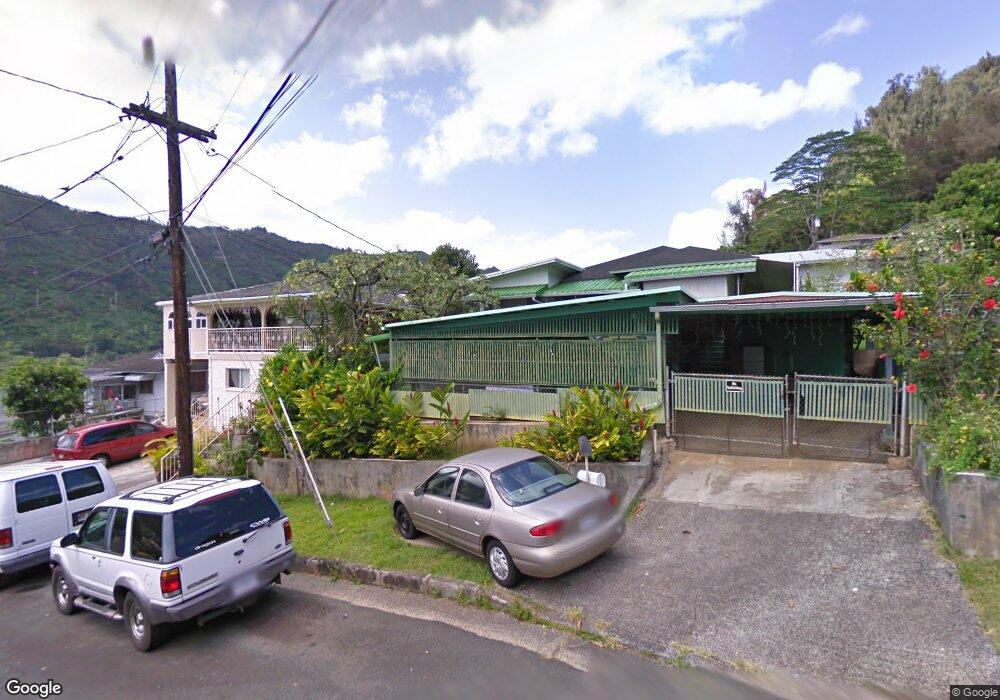
1653 Mahani Loop Honolulu, HI 96819
Kalihi Valley NeighborhoodEstimated Value: $807,000 - $1,000,000
4
Beds
2
Baths
1,452
Sq Ft
$613/Sq Ft
Est. Value
About This Home
This home is located at 1653 Mahani Loop, Honolulu, HI 96819 and is currently estimated at $890,801, approximately $613 per square foot. 1653 Mahani Loop is a home located in Honolulu County with nearby schools including Kalihi Elementary School, Governor Sanford B Dole Middle School, and Gov. Wallace Rider Farrington High School.
Ownership History
Date
Name
Owned For
Owner Type
Purchase Details
Closed on
Oct 31, 2003
Sold by
Baysa Roldan Acierto and Baysa Rosa Sevilla
Bought by
Baysa Roldan Acierto and Baysa Rosa Sevilla
Current Estimated Value
Home Financials for this Owner
Home Financials are based on the most recent Mortgage that was taken out on this home.
Original Mortgage
$253,000
Interest Rate
5.72%
Mortgage Type
Unknown
Purchase Details
Closed on
Nov 17, 1995
Sold by
Chun Thomas
Bought by
Baysa Roldan Acierto and Baysa Rosa Sevilla
Home Financials for this Owner
Home Financials are based on the most recent Mortgage that was taken out on this home.
Original Mortgage
$275,500
Interest Rate
7.51%
Purchase Details
Closed on
Jun 17, 1994
Sold by
Chun Thomas
Bought by
Chun Thomas and Thomas Chun Jr Trust
Create a Home Valuation Report for This Property
The Home Valuation Report is an in-depth analysis detailing your home's value as well as a comparison with similar homes in the area
Home Values in the Area
Average Home Value in this Area
Purchase History
| Date | Buyer | Sale Price | Title Company |
|---|---|---|---|
| Baysa Roldan Acierto | -- | -- | |
| Baysa Roldan Acierto | $290,000 | -- | |
| Chun Thomas | -- | -- | |
| Chun Thomas | -- | -- |
Source: Public Records
Mortgage History
| Date | Status | Borrower | Loan Amount |
|---|---|---|---|
| Closed | Baysa Roldan Acierto | $253,000 | |
| Closed | Baysa Roldan Acierto | $275,500 |
Source: Public Records
Tax History Compared to Growth
Tax History
| Year | Tax Paid | Tax Assessment Tax Assessment Total Assessment is a certain percentage of the fair market value that is determined by local assessors to be the total taxable value of land and additions on the property. | Land | Improvement |
|---|---|---|---|---|
| 2025 | $2,899 | $978,900 | $890,900 | $88,000 |
| 2024 | $2,899 | $988,300 | $913,700 | $74,600 |
| 2023 | $2,526 | $961,800 | $913,700 | $48,100 |
| 2022 | $2,622 | $889,000 | $731,000 | $158,000 |
| 2021 | $2,177 | $761,900 | $662,400 | $99,500 |
| 2020 | $2,178 | $762,300 | $685,300 | $77,000 |
| 2019 | $2,154 | $735,300 | $685,300 | $50,000 |
| 2018 | $1,984 | $686,900 | $616,800 | $70,100 |
| 2017 | $1,668 | $596,500 | $582,500 | $14,000 |
| 2016 | $1,778 | $628,000 | $490,800 | $137,200 |
| 2015 | $1,449 | $534,000 | $459,500 | $74,500 |
| 2014 | $1,445 | $592,100 | $459,500 | $132,600 |
Source: Public Records
Map
Nearby Homes
- 1829 Akone Place
- 2871 Kalihi St Unit H
- 2704 Kalihi St
- 1565 Moani St
- 1581 Murphy St
- 1625 Kalaepaa Dr
- 1740 Kamohoalii St
- 1592 Perry St
- 1709 Perry St
- 2248 Makanani Dr
- 2285 Makanani Dr
- 2526 Waolani Ave
- 1708 Kealia Dr
- 1186 Alewa Dr
- 1736 Gulick Ave
- 2023 Houghtailing St
- 2716 Rooke Ave Unit A
- 1846 Makuahine Place
- 1912 Aupuni St
- 2004 Skyline Dr
- 1651 Mahani Loop
- 1730 Kuikele St
- 1736 Kuikele St
- 1657 Mahani Loop
- 1722 Kuikele St
- 1645 Mahani Loop
- 1742 Kuikele St
- 1668 Mahani Loop
- 1716 Kuikele St
- 1641 Mahani Loop
- 1648 Mahani Loop
- 1661 Mahani Loop
- 1748 Kuikele St
- 1727 Kuikele St
- 1733 Kuikele St
- 1667 Mahani Loop
- 1708 Kuikele St
- 1721 Kuikele St
- 1642 Mahani Loop
- 1682 Mahani Loop