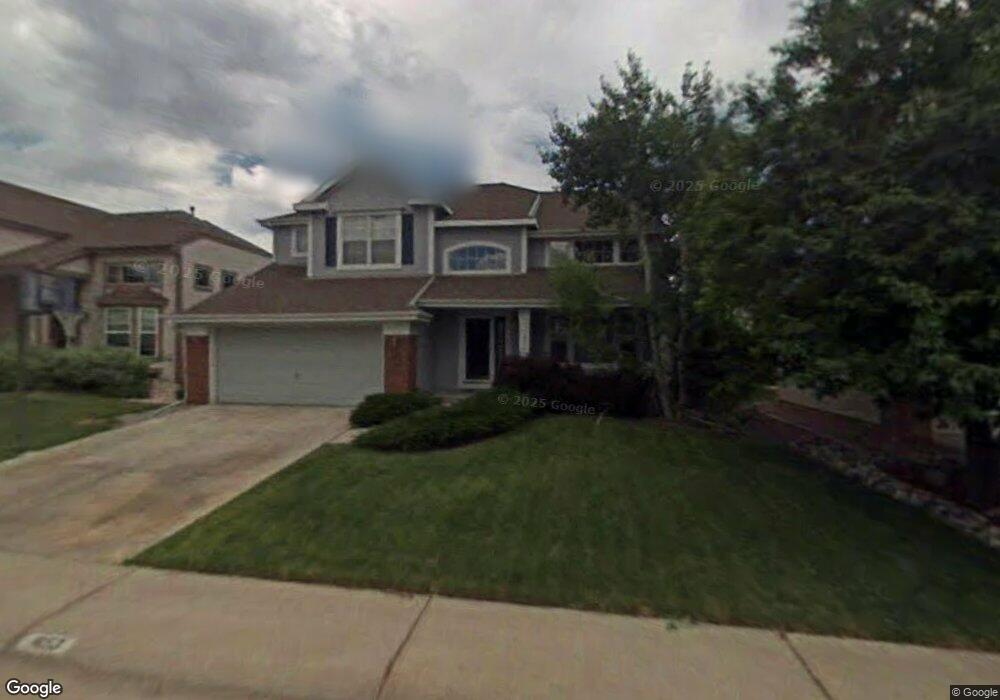
1653 Mountain Maple Ave Highlands Ranch, CO 80129
Westridge NeighborhoodEstimated Value: $660,000 - $749,000
3
Beds
4
Baths
2,092
Sq Ft
$331/Sq Ft
Est. Value
About This Home
This home is located at 1653 Mountain Maple Ave, Highlands Ranch, CO 80129 and is currently estimated at $692,661, approximately $331 per square foot. 1653 Mountain Maple Ave is a home located in Douglas County with nearby schools including Coyote Creek Elementary School, Ranch View Middle School, and Thunderridge High School.
Ownership History
Date
Name
Owned For
Owner Type
Purchase Details
Closed on
May 31, 1995
Sold by
High View Homes Llc
Bought by
Jenkins Donald Allen and Jenkins Dale Ann
Current Estimated Value
Home Financials for this Owner
Home Financials are based on the most recent Mortgage that was taken out on this home.
Original Mortgage
$135,150
Interest Rate
8.18%
Purchase Details
Closed on
Oct 31, 1994
Sold by
Mission Viejo Co
Bought by
High View Homes Llc
Create a Home Valuation Report for This Property
The Home Valuation Report is an in-depth analysis detailing your home's value as well as a comparison with similar homes in the area
Home Values in the Area
Average Home Value in this Area
Purchase History
| Date | Buyer | Sale Price | Title Company |
|---|---|---|---|
| Jenkins Donald Allen | $168,940 | Land Title | |
| High View Homes Llc | $90,800 | -- |
Source: Public Records
Mortgage History
| Date | Status | Borrower | Loan Amount |
|---|---|---|---|
| Closed | Jenkins Donald Allen | $135,150 |
Source: Public Records
Tax History Compared to Growth
Tax History
| Year | Tax Paid | Tax Assessment Tax Assessment Total Assessment is a certain percentage of the fair market value that is determined by local assessors to be the total taxable value of land and additions on the property. | Land | Improvement |
|---|---|---|---|---|
| 2024 | $3,285 | $45,230 | $12,080 | $33,150 |
| 2023 | $3,279 | $45,230 | $12,080 | $33,150 |
| 2022 | $2,486 | $34,150 | $8,810 | $25,340 |
| 2021 | $2,585 | $34,150 | $8,810 | $25,340 |
| 2020 | $3,108 | $33,510 | $7,980 | $25,530 |
| 2019 | $3,119 | $33,510 | $7,980 | $25,530 |
| 2018 | $2,746 | $29,060 | $7,570 | $21,490 |
| 2017 | $2,501 | $29,060 | $7,570 | $21,490 |
| 2016 | $2,389 | $27,250 | $7,260 | $19,990 |
| 2015 | $2,441 | $27,250 | $7,260 | $19,990 |
| 2014 | $2,210 | $22,780 | $6,210 | $16,570 |
Source: Public Records
Map
Nearby Homes
- 1864 Mountain Maple Ave
- 10473 Grizzly Gulch
- 1993 Mountain Maple Ave
- 1113 Southbury Place
- 1660 Meyerwood Cir
- 10347 Woodrose Ln
- 10578 Hyacinth Ln
- 978 Sage Sparrow Cir
- 10505 Hyacinth Place
- 1281 Riddlewood Rd
- 2627 Baneberry Ln
- 885 Sage Sparrow Cir
- 1086 Thornbury Place
- 1104 W Timbervale Trail
- 10544 Soulmark Way
- 907 Riddlewood Ln
- 10060 Royal Eagle Ln
- 9755 Spring Hill St
- 664 Tiger Lily Way
- 1294 Braewood Ave
- 1667 Mountain Maple Ave
- 1637 Mountain Maple Ave
- 1658 Spring Water Place
- 1672 Spring Water Place
- 1625 Mountain Maple Ave
- 1644 Spring Water Place
- 1681 Mountain Maple Ave
- 1686 Spring Water Place
- 1654 Mountain Maple Ave
- 1668 Mountain Maple Ave
- 1640 Mountain Maple Ave
- 1695 Mountain Maple Ave
- 1626 Mountain Maple Ave
- 1704 Spring Water Place
- 1616 Spring Water Place
- 1604 Spring Water Ln
- 1612 Mountain Maple Ave
- 1696 Mountain Maple Ave
- 1716 Spring Water Place
- 1709 Mountain Maple Ave