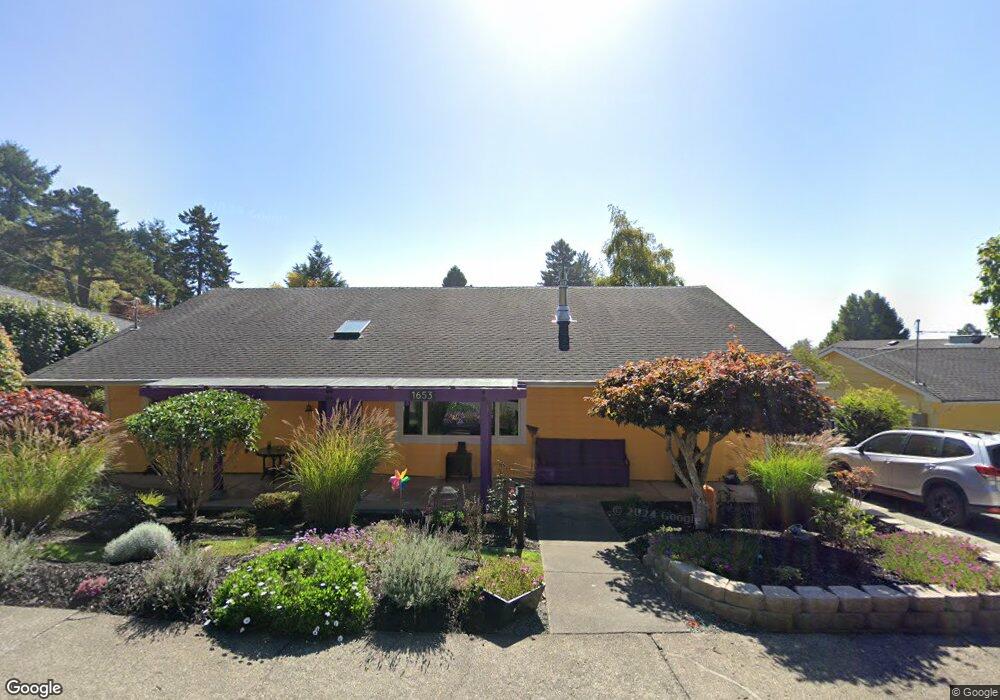
1653 Virginia Way Arcata, CA 95521
Sunny Brae NeighborhoodEstimated Value: $468,000 - $576,000
3
Beds
1
Bath
1,068
Sq Ft
$503/Sq Ft
Est. Value
About This Home
This home is located at 1653 Virginia Way, Arcata, CA 95521 and is currently estimated at $536,869, approximately $502 per square foot. 1653 Virginia Way is a home located in Humboldt County with nearby schools including Arcata Elementary School, Sunny Brae Middle School, and Arcata High School.
Ownership History
Date
Name
Owned For
Owner Type
Purchase Details
Closed on
Aug 2, 2018
Sold by
Maryanne Levine
Bought by
Maryanne Levine 2018 Living Tr
Current Estimated Value
Purchase Details
Closed on
Jul 28, 2015
Sold by
Belfer Friedman Jenny and Belfer Levine Gita
Bought by
Levine Maryanne
Purchase Details
Closed on
Feb 6, 2014
Sold by
Levine Maryanne and Maryanne Levine Trust
Bought by
Belfer Friedman Jenny and Belfer Levine Gita
Purchase Details
Closed on
May 17, 2011
Sold by
Levine Maryanne
Bought by
Levine Maryanne and Maryanne Levine Trust
Purchase Details
Closed on
Jan 5, 1999
Sold by
Levine Mary A
Bought by
Levine Mary Anne
Home Financials for this Owner
Home Financials are based on the most recent Mortgage that was taken out on this home.
Original Mortgage
$68,000
Interest Rate
6.66%
Create a Home Valuation Report for This Property
The Home Valuation Report is an in-depth analysis detailing your home's value as well as a comparison with similar homes in the area
Home Values in the Area
Average Home Value in this Area
Purchase History
| Date | Buyer | Sale Price | Title Company |
|---|---|---|---|
| Maryanne Levine 2018 Living Tr | -- | None Listed On Document | |
| Levine Maryanne | -- | None Available | |
| Belfer Friedman Jenny | -- | None Available | |
| Levine Maryanne | -- | None Available | |
| Levine Mary Anne | -- | Fidelity National Title Co |
Source: Public Records
Mortgage History
| Date | Status | Borrower | Loan Amount |
|---|---|---|---|
| Previous Owner | Levine Mary Anne | $68,000 |
Source: Public Records
Tax History Compared to Growth
Tax History
| Year | Tax Paid | Tax Assessment Tax Assessment Total Assessment is a certain percentage of the fair market value that is determined by local assessors to be the total taxable value of land and additions on the property. | Land | Improvement |
|---|---|---|---|---|
| 2025 | $2,525 | $214,998 | $52,530 | $162,468 |
| 2024 | $2,525 | $210,783 | $51,500 | $159,283 |
| 2023 | $2,474 | $206,651 | $50,491 | $156,160 |
| 2022 | $2,515 | $202,600 | $49,501 | $153,099 |
| 2021 | $2,400 | $198,629 | $48,531 | $150,098 |
| 2020 | $2,317 | $196,593 | $48,034 | $148,559 |
| 2019 | $2,243 | $192,740 | $47,093 | $145,647 |
| 2018 | $2,169 | $188,962 | $46,170 | $142,792 |
| 2017 | $2,145 | $185,258 | $45,265 | $139,993 |
| 2016 | $2,069 | $181,627 | $44,378 | $137,249 |
| 2015 | $2,046 | $178,900 | $43,712 | $135,188 |
| 2014 | $2,040 | $175,396 | $42,856 | $132,540 |
Source: Public Records
Map
Nearby Homes
- 1570 Lena Ave
- 753 Shirley Blvd
- 3255 Buttermilk Ln
- 2320 Golf Course Rd
- 2099 Fickle Hill Rd
- 0 E 16th St Unit 269160
- 000 E 16th St
- 120 & 120a 13th St
- 1016 F St
- 16 & 46 G St
- 632 9th St
- 11.8 Acres Idylbear Ln
- 115 G St
- 119 Sylva St
- 113 Sylva St
- 12.3 Acres Splinter Ln
- 2910 Greenbriar Ln
- 429 Evergreen Ave
- 356 California Ave
- 450 Stephens Ln
- 1645 Virginia Way
- 1675 Virginia Way
- 1654 Chester Ave
- 1693 Virginia Way
- 1635 Virginia Way
- 1644 Chester Ave
- 1666 Chester Ave
- 1658 Virginia Way
- 1676 Virginia Way
- 1648 Virginia Way
- 1632 Chester Ave
- 1692 Virginia Way
- 1701 Virginia Way
- 1670 Chester Ave
- 1623 Virginia Way
- 1700 Virginia Way
- 1636 Virginia Way
- 1624 Chester Ave
- 1704 Virginia Way
- 1685 Charles Ave