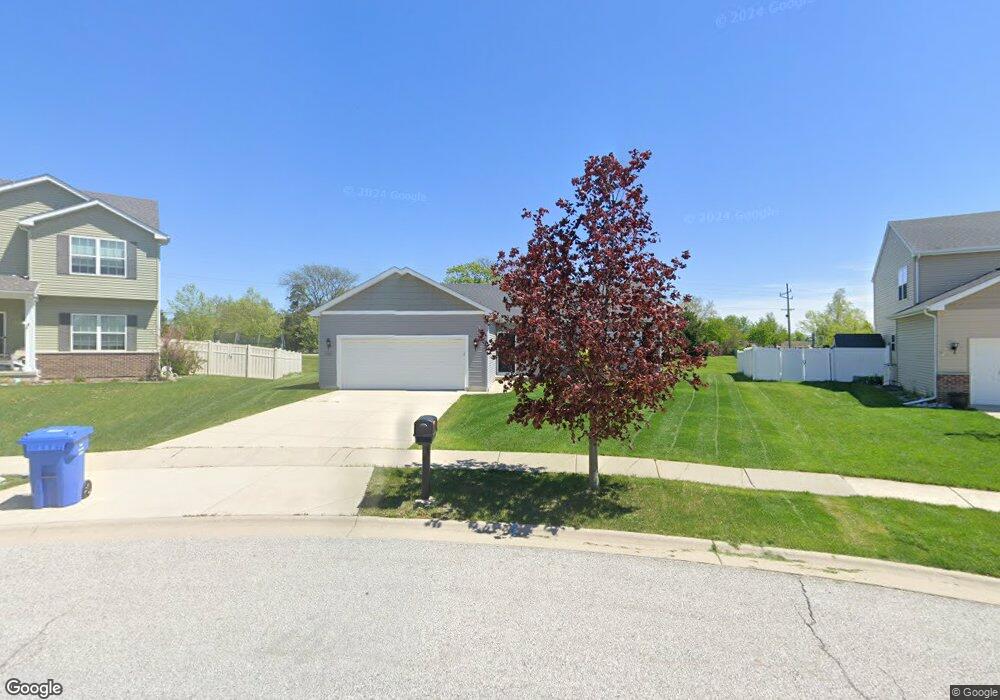
1653 W 129th Ct Crown Point, IN 46307
Estimated Value: $391,170 - $424,000
2
Beds
2
Baths
1,704
Sq Ft
$240/Sq Ft
Est. Value
About This Home
This home is located at 1653 W 129th Ct, Crown Point, IN 46307 and is currently estimated at $408,793, approximately $239 per square foot. 1653 W 129th Ct is a home with nearby schools including Dwight D. Eisenhower Elementary School, Robert Taft Middle School, and Crown Point High School.
Ownership History
Date
Name
Owned For
Owner Type
Purchase Details
Closed on
Nov 14, 2013
Sold by
Providence Homes At Regency Inc
Bought by
Calinski Teresa
Current Estimated Value
Home Financials for this Owner
Home Financials are based on the most recent Mortgage that was taken out on this home.
Original Mortgage
$125,000
Outstanding Balance
$92,736
Interest Rate
4.1%
Mortgage Type
New Conventional
Estimated Equity
$316,057
Purchase Details
Closed on
Jul 31, 2013
Sold by
The Regency Of Crown Point Llc
Bought by
Providence Homes At Regency Inc
Purchase Details
Closed on
Feb 24, 2011
Sold by
Lake County Trust
Bought by
The Regency Of Crown Point Llc
Create a Home Valuation Report for This Property
The Home Valuation Report is an in-depth analysis detailing your home's value as well as a comparison with similar homes in the area
Home Values in the Area
Average Home Value in this Area
Purchase History
| Date | Buyer | Sale Price | Title Company |
|---|---|---|---|
| Calinski Teresa | -- | Chicago Title Ins Co | |
| Providence Homes At Regency Inc | -- | None Available | |
| The Regency Of Crown Point Llc | -- | Chicago Title Insurance Co |
Source: Public Records
Mortgage History
| Date | Status | Borrower | Loan Amount |
|---|---|---|---|
| Open | Calinski Teresa | $125,000 |
Source: Public Records
Tax History Compared to Growth
Tax History
| Year | Tax Paid | Tax Assessment Tax Assessment Total Assessment is a certain percentage of the fair market value that is determined by local assessors to be the total taxable value of land and additions on the property. | Land | Improvement |
|---|---|---|---|---|
| 2024 | $9,067 | $359,700 | $68,100 | $291,600 |
| 2023 | $3,648 | $329,900 | $68,100 | $261,800 |
| 2022 | $3,486 | $312,100 | $68,100 | $244,000 |
| 2021 | $3,329 | $298,300 | $68,100 | $230,200 |
| 2020 | $3,171 | $284,400 | $68,100 | $216,300 |
| 2019 | $3,091 | $277,400 | $68,100 | $209,300 |
| 2018 | $3,699 | $268,300 | $68,100 | $200,200 |
| 2017 | $3,671 | $263,900 | $68,100 | $195,800 |
| 2016 | $3,589 | $255,300 | $68,100 | $187,200 |
| 2014 | $3,360 | $253,000 | $68,100 | $184,900 |
| 2013 | $5 | $200 | $200 | $0 |
Source: Public Records
Map
Nearby Homes
- 12819 Grant St
- 12938 Hayes St
- 13192 Hayes St
- 13085 Taft St
- 13111 Taft St
- 2439 W 127th Ave
- 253 W 129th Ave Unit 1
- 809 W 126th Ct
- 1790 W 134th Ct
- 253 Nomo Place
- 2725 W 127th Ln
- 283 Nomo Place
- 12768 Ellsworth Place
- 244 Sawgrass Dr
- 246 Sawgrass Dr
- The Ganby Plan at Sawgrass
- The Monarch Plan at Sawgrass
- The Keystone Plan at Sawgrass
- The Breckenridge Plan at Sawgrass
- 248 Sawgrass Dr
- 1663 W 129th Ct
- 1654 W 129th Ct
- 1689 W 129th Ct
- 1664 W 129th Ct
- 1703 W 129th Ct
- 12919 Grant St
- 1678 W 129th Ct
- 1704 W 129th Ct
- 1690 W 129th Ct
- 1718 W 129th Ct
- 12989 Hayes St
- 13003 Hayes St
- 12995 Hayes St
- 1734 W 129th Ct
- 12929 Grant St
- 12828 Grant St
- 13011 Hayes St
- 12943 Hayes St
- 12988 Hayes St
- 12931 Hayes St