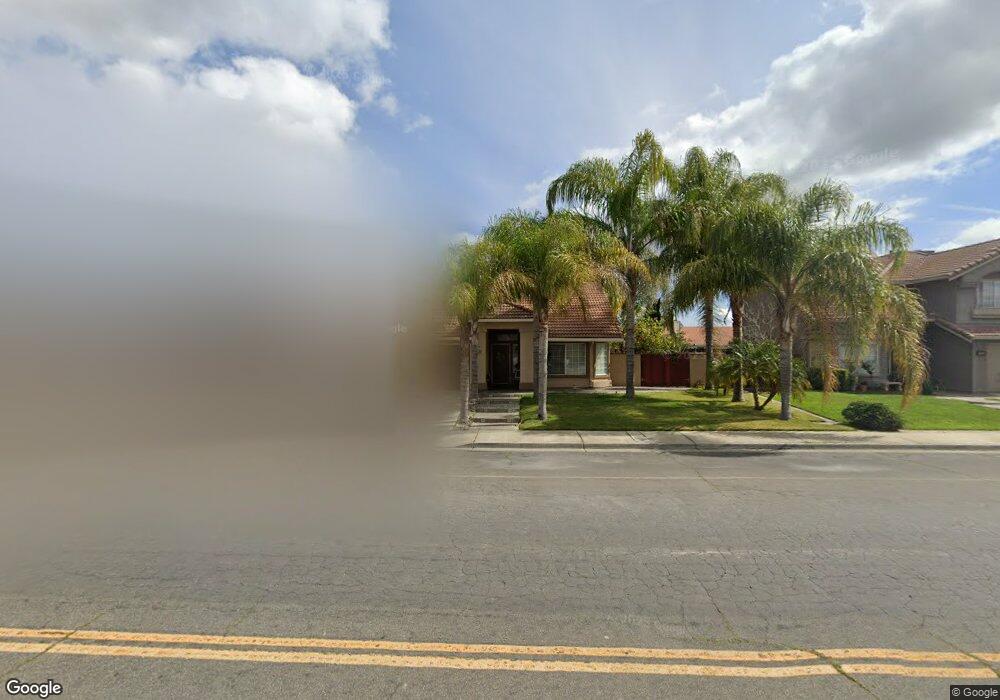
1654 W I St Los Banos, CA 93635
Estimated Value: $243,000 - $556,000
3
Beds
2
Baths
1,854
Sq Ft
$245/Sq Ft
Est. Value
About This Home
This home is located at 1654 W I St, Los Banos, CA 93635 and is currently estimated at $453,539, approximately $244 per square foot. 1654 W I St is a home located in Merced County with nearby schools including Henry Miller Elementary School, Creekside Junior High School, and Los Banos High School.
Ownership History
Date
Name
Owned For
Owner Type
Purchase Details
Closed on
Jul 15, 2016
Sold by
Dela Torre Anna M
Bought by
Delatorre Jose G and Delatorre Anna M
Current Estimated Value
Home Financials for this Owner
Home Financials are based on the most recent Mortgage that was taken out on this home.
Original Mortgage
$150,000
Outstanding Balance
$68,079
Interest Rate
3.6%
Mortgage Type
New Conventional
Estimated Equity
$385,460
Purchase Details
Closed on
Nov 18, 2010
Sold by
U S Bank National Association
Bought by
Dela Torre Anna M
Home Financials for this Owner
Home Financials are based on the most recent Mortgage that was taken out on this home.
Original Mortgage
$132,552
Interest Rate
4.17%
Mortgage Type
FHA
Purchase Details
Closed on
Jun 29, 2010
Sold by
Bayuga Douglas and Bayuga Mary
Bought by
U S Bank National Association
Create a Home Valuation Report for This Property
The Home Valuation Report is an in-depth analysis detailing your home's value as well as a comparison with similar homes in the area
Home Values in the Area
Average Home Value in this Area
Purchase History
| Date | Buyer | Sale Price | Title Company |
|---|---|---|---|
| Delatorre Jose G | -- | Stewart Title Of Ca Inc | |
| Dela Torre Anna M | $136,000 | Lawyers Title | |
| U S Bank National Association | $126,000 | Accommodation |
Source: Public Records
Mortgage History
| Date | Status | Borrower | Loan Amount |
|---|---|---|---|
| Open | Delatorre Jose G | $150,000 | |
| Closed | Dela Torre Anna M | $132,552 |
Source: Public Records
Tax History Compared to Growth
Tax History
| Year | Tax Paid | Tax Assessment Tax Assessment Total Assessment is a certain percentage of the fair market value that is determined by local assessors to be the total taxable value of land and additions on the property. | Land | Improvement |
|---|---|---|---|---|
| 2025 | $2,407 | $189,383 | $12,806 | $176,577 |
| 2024 | $2,407 | $185,670 | $12,555 | $173,115 |
| 2023 | $2,263 | $182,030 | $12,309 | $169,721 |
| 2022 | $2,208 | $178,462 | $12,068 | $166,394 |
| 2021 | $2,167 | $174,964 | $11,832 | $163,132 |
| 2020 | $1,972 | $159,314 | $11,711 | $147,603 |
| 2019 | $1,935 | $156,191 | $11,482 | $144,709 |
| 2018 | $1,877 | $153,129 | $11,257 | $141,872 |
| 2017 | $1,853 | $150,128 | $11,037 | $139,091 |
| 2016 | $1,854 | $147,185 | $10,821 | $136,364 |
| 2015 | $1,804 | $144,975 | $10,659 | $134,316 |
| 2014 | $1,744 | $142,136 | $10,451 | $131,685 |
Source: Public Records
Map
Nearby Homes
- 1631 Fir Dr
- 1622 Fir Dr
- 942 Garden St
- 1010 Neal St
- 859 Sandra St
- 1036 Sandra St
- 662 Willow Way
- 1149 Bellflower Way
- 1862 Dunite Dr
- 683 Alder Ln
- 1125 Pearl Dr
- 1732 Cobblefield Ln
- 1859 Felsite St
- 1502 Paradise Ln
- 1619 Tumbleweed Way
- 1664 Dolomite Dr
- The Pacifica Plan at Westbrook
- The Big Sur Plan at Westbrook
- The Capitola Plan at Westbrook
- The Montara Plan at Westbrook