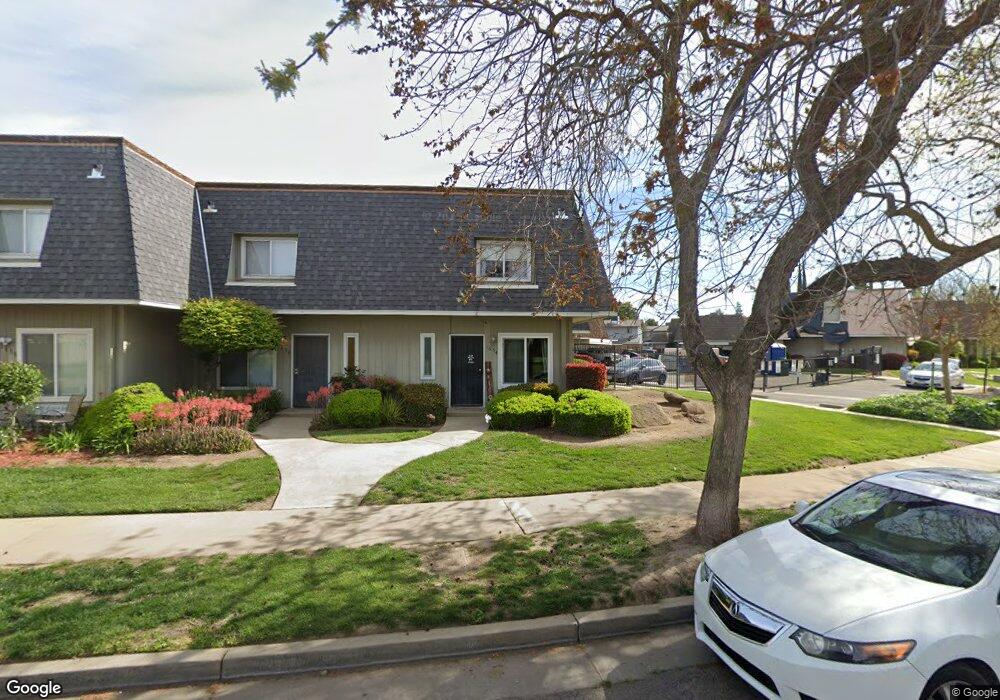
1654 W N Bear Creek Dr Unit 10 Merced, CA 95348
Estimated Value: $211,000 - $229,000
2
Beds
3
Baths
972
Sq Ft
$227/Sq Ft
Est. Value
About This Home
This home is located at 1654 W N Bear Creek Dr Unit 10, Merced, CA 95348 and is currently estimated at $220,394, approximately $226 per square foot. 1654 W N Bear Creek Dr Unit 10 is a home located in Merced County with nearby schools including Luther Burbank Elementary School, Tenaya Middle School, and Merced High School.
Ownership History
Date
Name
Owned For
Owner Type
Purchase Details
Closed on
Aug 4, 2016
Sold by
Wilmington Savings Fund Society Fsb
Bought by
Moreno Fernando Antonio and Moreno Jessica
Current Estimated Value
Purchase Details
Closed on
Jan 14, 2016
Sold by
Khwaja Enayat and Khwaja Malalai
Bought by
Wilmington Savings Fund Society Fsb
Purchase Details
Closed on
Sep 20, 2005
Sold by
Roton Melissa and Roton Melissa R
Bought by
Khwaja Enayat and Khwaja Malalai
Purchase Details
Closed on
Jul 5, 2001
Sold by
American Stategic Income Portfolio Inc I
Bought by
Roton Melissa R
Home Financials for this Owner
Home Financials are based on the most recent Mortgage that was taken out on this home.
Original Mortgage
$42,180
Interest Rate
7.19%
Purchase Details
Closed on
Apr 9, 2001
Sold by
Storey Thomas Arenzo and Storey Brenda Ann
Bought by
American Strategic Income Portfolio Inc
Create a Home Valuation Report for This Property
The Home Valuation Report is an in-depth analysis detailing your home's value as well as a comparison with similar homes in the area
Home Values in the Area
Average Home Value in this Area
Purchase History
| Date | Buyer | Sale Price | Title Company |
|---|---|---|---|
| Moreno Fernando Antonio | $67,000 | Chicago Title Company | |
| Wilmington Savings Fund Society Fsb | $100,483 | Accommodation | |
| Khwaja Enayat | $160,000 | Fidelity Natl Title Co Of Ca | |
| Roton Melissa R | $44,000 | -- | |
| American Strategic Income Portfolio Inc | $28,357 | Stewart Title |
Source: Public Records
Mortgage History
| Date | Status | Borrower | Loan Amount |
|---|---|---|---|
| Previous Owner | Roton Melissa R | $42,180 | |
| Closed | Roton Melissa R | $1,320 |
Source: Public Records
Tax History Compared to Growth
Tax History
| Year | Tax Paid | Tax Assessment Tax Assessment Total Assessment is a certain percentage of the fair market value that is determined by local assessors to be the total taxable value of land and additions on the property. | Land | Improvement |
|---|---|---|---|---|
| 2025 | $828 | $77,751 | $23,209 | $54,542 |
| 2024 | $828 | $76,227 | $22,754 | $53,473 |
| 2023 | $598 | $54,333 | $22,308 | $32,025 |
| 2022 | $804 | $73,269 | $21,871 | $51,398 |
| 2021 | $803 | $71,834 | $21,443 | $50,391 |
| 2020 | $807 | $71,099 | $21,224 | $49,875 |
| 2019 | $796 | $69,706 | $20,808 | $48,898 |
| 2018 | $725 | $68,340 | $20,400 | $47,940 |
| 2017 | $753 | $67,000 | $20,000 | $47,000 |
| 2016 | $733 | $65,000 | $20,000 | $45,000 |
| 2015 | $666 | $59,000 | $35,000 | $24,000 |
| 2014 | $620 | $55,000 | $15,000 | $40,000 |
Source: Public Records
Map
Nearby Homes
- 1646 W North Bear Creek Dr
- 2500 N Highway 59 #115
- 2500 N State Highway 59
- 2500 N State Highway 59 Unit 36
- 2440 Crystal Springs Ave
- 1911 U St
- 2215 W St
- 1475 Bianchi Ln
- 1941 Rogina Ave
- 1482 Autry Way
- 2941 Ritter Ln
- 1110 V St
- 1342 Massasso St
- 1842 Heritage Dr
- 1420 W 25th St
- 980 Sydney Ln
- 1803 Lopes Ave
- 1044 W 20th St
- 1413 W 9th St
- 1127 W 23rd St
- 1654 W North Bear Creek Dr
- 1656 W North Bear Creek Dr Unit 9
- 1658 Bear Creek Dr Wn Dr
- 1658 W North Bear Creek Dr
- 1658 Bear Creek Wn Dr
- 1660 W North Bear Creek Dr
- 1662 W North Bear Creek Dr
- 1664 W North Bear Creek Dr Unit 5
- 1666 W North Bear Creek Dr
- 1666 Bear Creek Dr
- 1970 Shadowbrook Dr
- 1644 W North Bear Creek Dr
- 1976 Shadowbrook Dr
- 1644 W North Bear Creek Dr
- 1644 W N Bear Creek Dr Unit 40
- 1668 W North Bear Creek Dr
- 1972 Shadowbrook Dr
- 1942 Shadowbrook Dr
- 1940 Shadowbrook Dr
- 1670 W North Bear Creek Dr