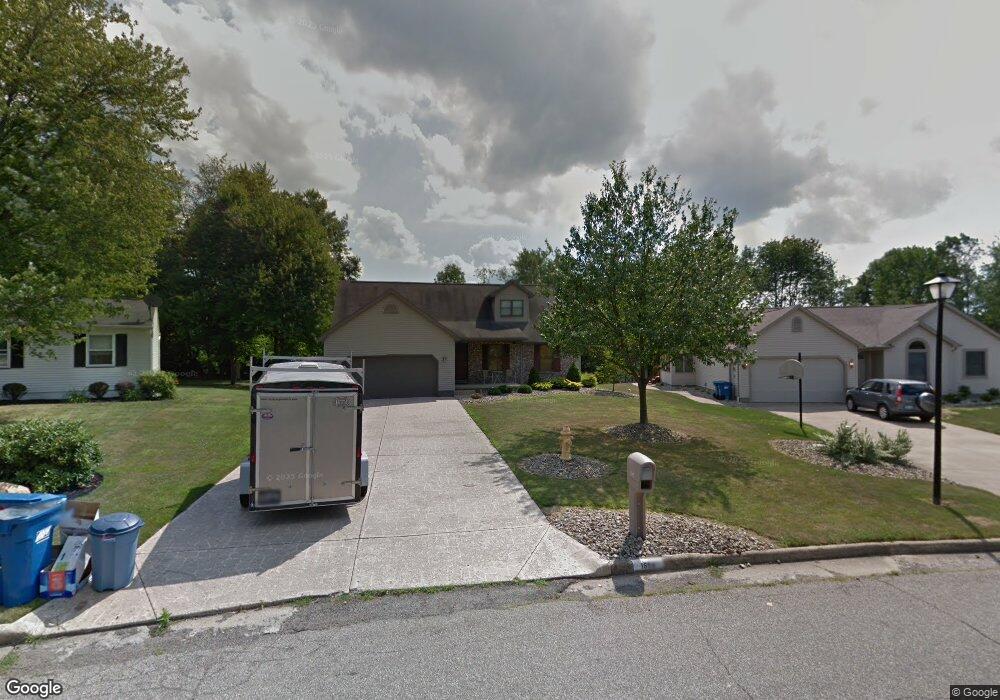
1654 Warner Ct Mineral Ridge, OH 44440
Estimated Value: $289,069 - $320,000
3
Beds
4
Baths
1,909
Sq Ft
$160/Sq Ft
Est. Value
About This Home
This home is located at 1654 Warner Ct, Mineral Ridge, OH 44440 and is currently estimated at $305,517, approximately $160 per square foot. 1654 Warner Ct is a home located in Trumbull County with nearby schools including Seaborn Elementary School, Mineral Ridge High School, and Niles Preparatory Academy.
Ownership History
Date
Name
Owned For
Owner Type
Purchase Details
Closed on
Oct 21, 2019
Sold by
Potts Anthony A and Potts Erin C
Bought by
Monteneri Laura D
Current Estimated Value
Purchase Details
Closed on
May 15, 2017
Sold by
Fannie Mae
Bought by
Potts Anthony Andrew
Purchase Details
Closed on
Dec 21, 2016
Sold by
James A Brown
Bought by
Potts Erin and Potts Anthony
Home Financials for this Owner
Home Financials are based on the most recent Mortgage that was taken out on this home.
Original Mortgage
$40,384
Interest Rate
4.16%
Purchase Details
Closed on
Sep 24, 2002
Sold by
Bucci Dominic T
Bought by
Potts Anthony A and Potts Erin C
Purchase Details
Closed on
Feb 24, 1994
Sold by
Beshara James
Bought by
Dominic T Bucci
Purchase Details
Closed on
Jan 1, 1990
Bought by
James Beshara
Create a Home Valuation Report for This Property
The Home Valuation Report is an in-depth analysis detailing your home's value as well as a comparison with similar homes in the area
Home Values in the Area
Average Home Value in this Area
Purchase History
| Date | Buyer | Sale Price | Title Company |
|---|---|---|---|
| Monteneri Laura D | $195,000 | None Available | |
| Potts Anthony Andrew | $8,600 | None Available | |
| Potts Erin | -- | -- | |
| Potts Anthony A | $154,000 | -- | |
| Dominic T Bucci | $12,000 | -- | |
| James Beshara | -- | -- |
Source: Public Records
Mortgage History
| Date | Status | Borrower | Loan Amount |
|---|---|---|---|
| Previous Owner | Potts Anthony A | $40,384 | |
| Previous Owner | Potts Anthony A | -- |
Source: Public Records
Tax History Compared to Growth
Tax History
| Year | Tax Paid | Tax Assessment Tax Assessment Total Assessment is a certain percentage of the fair market value that is determined by local assessors to be the total taxable value of land and additions on the property. | Land | Improvement |
|---|---|---|---|---|
| 2024 | $3,342 | $79,490 | $6,860 | $72,630 |
| 2023 | $3,342 | $79,490 | $6,860 | $72,630 |
| 2022 | $2,734 | $62,090 | $6,860 | $55,230 |
| 2021 | $2,732 | $62,090 | $6,860 | $55,230 |
| 2020 | $3,270 | $62,090 | $6,860 | $55,230 |
| 2019 | $2,957 | $53,660 | $6,860 | $46,800 |
| 2018 | $2,944 | $53,660 | $6,860 | $46,800 |
| 2017 | $2,943 | $53,660 | $6,860 | $46,800 |
| 2016 | $2,782 | $48,410 | $6,860 | $41,550 |
| 2015 | $2,777 | $48,410 | $6,860 | $41,550 |
| 2014 | $2,778 | $48,410 | $6,860 | $41,550 |
| 2013 | $2,739 | $48,410 | $6,860 | $41,550 |
Source: Public Records
Map
Nearby Homes
- 1684 Morris St
- 1676 Rosalyn Cir
- 3872 Main St
- 3474 S Main St
- 1757 E County Line Rd
- 1445 E County Line Rd
- 3907 Edwards St
- 3440 Lakeside Dr
- 21 E Liberty St
- 3328 Main St
- 1218 Ohltown McDonald Rd
- 1239 Woodledge Dr
- 6 Omalia Dr
- 5085 Winslow Dr
- 2169 Salt Springs Rd
- 6360 Meander Glen Dr
- 6393 Meander Glen Dr
- 2957 Greenfield Ave
- 2555 Walnut St
- 3050 Trumbull Ave
- 1650 Warner Ct
- 1658 Warner Ct
- 1646 Warner Ct
- 1664 Warner Ct
- 1592 Furnace St
- 1651 Warner Ct
- 1623 Laura Ln
- 1639 Laura Ln
- 1668 Warner Ct
- 1638 Warner Ct
- 1661 Warner Ct
- 1615 Laura Ln
- 3659 Ashland St
- 1667 Warner Ct
- 1674 Warner Ct
- 1647 Laura Ln
- 1601 Morris St
- 3645 Ashland St
- 1616 Warner Ave
- 1618 Warner Ave