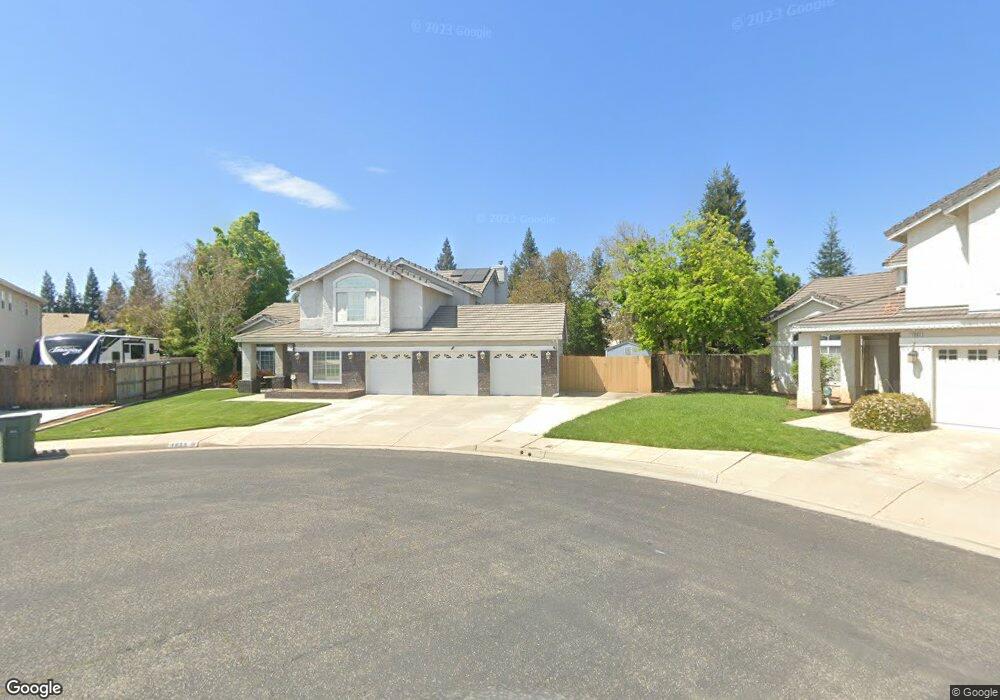
1655 El Paso Ave Clovis, CA 93611
Estimated Value: $658,000 - $676,718
4
Beds
4
Baths
2,815
Sq Ft
$238/Sq Ft
Est. Value
About This Home
This home is located at 1655 El Paso Ave, Clovis, CA 93611 and is currently estimated at $668,573, approximately $237 per square foot. 1655 El Paso Ave is a home located in Fresno County with nearby schools including Century Elementary School, Alta Sierra Intermediate School, and Buchanan High School.
Ownership History
Date
Name
Owned For
Owner Type
Purchase Details
Closed on
Feb 23, 2017
Sold by
Havens Ronald W and Havens Jeanne M
Bought by
Havens Ronald W
Current Estimated Value
Purchase Details
Closed on
Apr 23, 1996
Sold by
N T Hill Inc
Bought by
Havens Ronald W and Havens Jeanne M
Home Financials for this Owner
Home Financials are based on the most recent Mortgage that was taken out on this home.
Original Mortgage
$207,000
Outstanding Balance
$10,326
Interest Rate
7.97%
Estimated Equity
$658,247
Purchase Details
Closed on
Dec 5, 1995
Sold by
Fowler
Bought by
N T Hill Inc and R J Hill Company
Purchase Details
Closed on
Aug 24, 1993
Sold by
Sunnyside Venture
Bought by
Harris Breck and Andersen Janine Holli
Home Financials for this Owner
Home Financials are based on the most recent Mortgage that was taken out on this home.
Original Mortgage
$124,269
Interest Rate
7.13%
Mortgage Type
FHA
Create a Home Valuation Report for This Property
The Home Valuation Report is an in-depth analysis detailing your home's value as well as a comparison with similar homes in the area
Home Values in the Area
Average Home Value in this Area
Purchase History
| Date | Buyer | Sale Price | Title Company |
|---|---|---|---|
| Havens Ronald W | -- | None Available | |
| Havens Ronald W | $220,000 | Central Title Company | |
| N T Hill Inc | $40,000 | Central Title Company | |
| Harris Breck | $128,500 | North American Title Co Inc |
Source: Public Records
Mortgage History
| Date | Status | Borrower | Loan Amount |
|---|---|---|---|
| Open | Havens Ronald W | $207,000 | |
| Previous Owner | Harris Breck | $124,269 |
Source: Public Records
Tax History
| Year | Tax Paid | Tax Assessment Tax Assessment Total Assessment is a certain percentage of the fair market value that is determined by local assessors to be the total taxable value of land and additions on the property. | Land | Improvement |
|---|---|---|---|---|
| 2025 | $4,556 | $384,445 | $83,046 | $301,399 |
| 2023 | $4,384 | $369,519 | $79,822 | $289,697 |
| 2022 | $4,326 | $362,274 | $78,257 | $284,017 |
| 2021 | $4,185 | $355,172 | $76,723 | $278,449 |
| 2020 | $4,168 | $351,531 | $75,937 | $275,594 |
| 2019 | $4,087 | $344,640 | $74,449 | $270,191 |
| 2018 | $3,998 | $337,884 | $72,990 | $264,894 |
| 2017 | $3,929 | $331,259 | $71,559 | $259,700 |
| 2016 | $3,797 | $324,764 | $70,156 | $254,608 |
| 2015 | $3,739 | $319,887 | $69,103 | $250,784 |
| 2014 | $3,670 | $313,622 | $67,750 | $245,872 |
Source: Public Records
Map
Nearby Homes
- 1754 Decatur Ave
- 1977 Goshen Ave
- 8220 N Fowler Ave
- 878 N Ash Ave
- 1303 Jordan Ave
- 1323 Oak Ave
- 2117 Goshen Ave
- 1124 Oak Ave
- 971 N Filbert Ave
- 1490 Fir Ave
- 2361 Cromwell Ave
- 367 N Raphael Ln Unit 367
- 1152 Lester Ave
- 3664 E Serena Ave
- 1817 N Phillip Ave
- 5211 E Shepherd Ave
- 338 N Filbert Ave
- 1851 N Dupree Ln
- 2023 N Wagon Ln
- 2029 N Wagon Ln
- 1665 El Paso Ave
- 1645 El Paso Ave
- 1027 N Stanford Ave
- 1017 N Stanford Ave
- 1658 Goshen Ave
- 1648 Goshen Ave
- 1678 Goshen Ave
- 1007 N Stanford Ave
- 1638 Goshen Ave
- 1675 El Paso Ave
- 1688 Goshen Ave
- 1685 El Paso Ave
- 1698 Goshen Ave
- 1646 El Paso Ave
- 1656 El Paso Ave
- 1636 El Paso Ave
- 1022 N Stanford Ave
- 1012 N Stanford Ave
- 1666 El Paso Ave
- 1032 N Stanford Ave
Your Personal Tour Guide
Ask me questions while you tour the home.