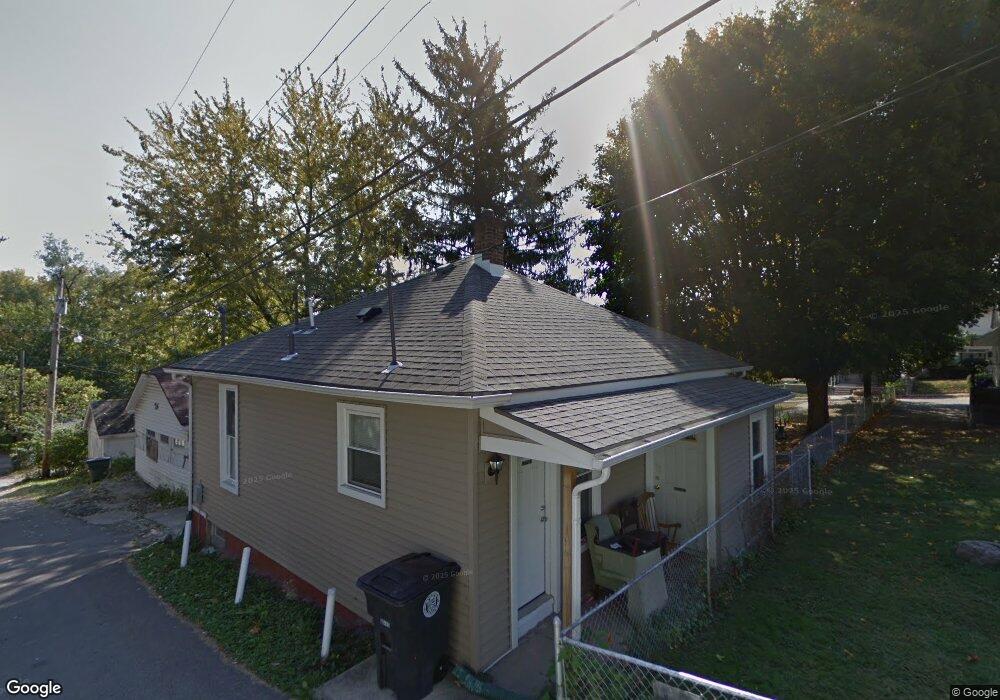
1655 Speice Ave Dayton, OH 45403
Eastern Hills NeighborhoodEstimated Value: $83,000 - $124,000
2
Beds
1
Bath
784
Sq Ft
$127/Sq Ft
Est. Value
About This Home
This home is located at 1655 Speice Ave, Dayton, OH 45403 and is currently estimated at $99,478, approximately $126 per square foot. 1655 Speice Ave is a home located in Montgomery County with nearby schools including Cleveland Elementary School, Eastmont Elementary, and Horace Mann Elementary School.
Ownership History
Date
Name
Owned For
Owner Type
Purchase Details
Closed on
Jul 13, 2022
Sold by
Buzard Michael D
Bought by
Greater Dayton Property Management Llc
Current Estimated Value
Purchase Details
Closed on
Apr 30, 2008
Sold by
Blanton Betty
Bought by
Buzard Michael D
Purchase Details
Closed on
Nov 1, 2007
Sold by
Va
Bought by
Blanton Betty
Purchase Details
Closed on
Oct 24, 2007
Sold by
Chase Home Finance Llc
Bought by
Va
Purchase Details
Closed on
Jun 29, 2007
Sold by
Adkins Donald K
Bought by
Chase Home Finance Llc
Purchase Details
Closed on
May 29, 2002
Sold by
Ramsey Angela L and Ramsey Thomas
Bought by
Adkins Donald K
Home Financials for this Owner
Home Financials are based on the most recent Mortgage that was taken out on this home.
Original Mortgage
$45,320
Interest Rate
6.87%
Mortgage Type
VA
Purchase Details
Closed on
Oct 16, 1997
Sold by
Hall Fred E
Bought by
Sawmiller Angela L
Create a Home Valuation Report for This Property
The Home Valuation Report is an in-depth analysis detailing your home's value as well as a comparison with similar homes in the area
Home Values in the Area
Average Home Value in this Area
Purchase History
| Date | Buyer | Sale Price | Title Company |
|---|---|---|---|
| Greater Dayton Property Management Llc | -- | None Listed On Document | |
| Buzard Michael D | $23,800 | Attorney | |
| Blanton Betty | -- | None Available | |
| Va | -- | None Available | |
| Chase Home Finance Llc | $24,000 | None Available | |
| Adkins Donald K | $44,000 | -- | |
| Sawmiller Angela L | $33,800 | -- |
Source: Public Records
Mortgage History
| Date | Status | Borrower | Loan Amount |
|---|---|---|---|
| Previous Owner | Adkins Donald K | $45,320 |
Source: Public Records
Tax History Compared to Growth
Tax History
| Year | Tax Paid | Tax Assessment Tax Assessment Total Assessment is a certain percentage of the fair market value that is determined by local assessors to be the total taxable value of land and additions on the property. | Land | Improvement |
|---|---|---|---|---|
| 2024 | $1,098 | $18,870 | $4,600 | $14,270 |
| 2023 | $1,098 | $18,870 | $4,600 | $14,270 |
| 2022 | $1,058 | $14,050 | $3,430 | $10,620 |
| 2021 | $1,053 | $14,050 | $3,430 | $10,620 |
| 2020 | $1,051 | $14,050 | $3,430 | $10,620 |
| 2019 | $973 | $11,680 | $3,430 | $8,250 |
| 2018 | $975 | $11,680 | $3,430 | $8,250 |
| 2017 | $968 | $11,680 | $3,430 | $8,250 |
| 2016 | $1,041 | $11,980 | $3,430 | $8,550 |
| 2015 | $985 | $11,980 | $3,430 | $8,550 |
| 2014 | $985 | $11,980 | $3,430 | $8,550 |
| 2012 | -- | $13,190 | $5,350 | $7,840 |
Source: Public Records
Map
Nearby Homes
- 404 S Smithville Rd
- 1626 Darst Ave
- 1730 Darst Ave
- 420 Dawnview Ave
- 520 S Smithville Rd
- 1614 Huffman Ave Unit 1612
- 1629 Suman Ave
- 1800 Darst Ave
- 1815 Huffman Ave
- 108 Big Pine Rd
- 515 Heiss Ave Unit 515-517
- 521 Pollock Rd
- 1921 Emerald Ct
- 1620 Gondert Ave Unit 1618
- 1620 Gondert Ave
- 1714 Gondert Ave
- 4533 Maughn Dr
- 4856 Airway Rd
- 511 S Hayden Ave
- 715 Gondert Ave
- 1649 Speice Ave
- 1661 Speice Ave
- 1665 Speice Ave
- 1639 Speice Ave
- 1671 Speice Ave
- 4418 Burkhardt Ave
- 4424 Burkhardt Ave
- 4412 Burkhardt Ave
- 1635 Speice Ave
- 1650 Speice Ave
- 1654 Speice Ave
- 1660 Speice Ave
- 4436 Burkhardt Ave
- 1629 Speice Ave
- 1640 Speice Ave
- 4402 Burkhardt Ave
- 1638 Speice Ave
- 1703 Speice Ave
- 1634 Speice Ave
- 1664 Speice Ave