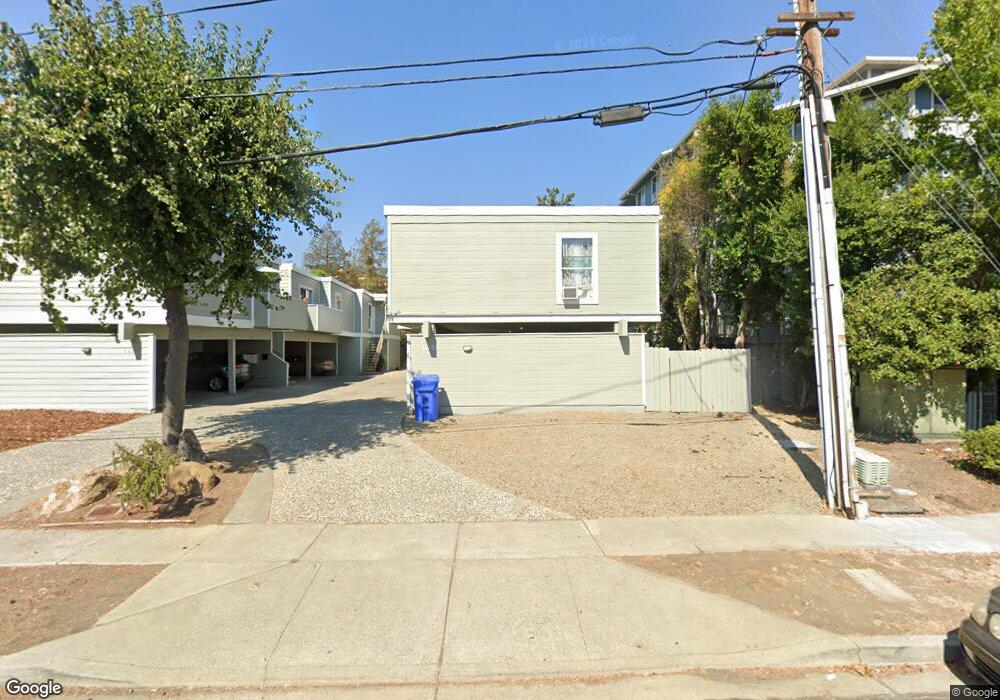
1655 Sutter St Unit 1 Concord, CA 94520
Downtown/Todos Santos NeighborhoodEstimated Value: $964,266 - $1,292,000
--
Bed
--
Bath
3,257
Sq Ft
$342/Sq Ft
Est. Value
About This Home
This home is located at 1655 Sutter St Unit 1, Concord, CA 94520 and is currently estimated at $1,114,317, approximately $342 per square foot. 1655 Sutter St Unit 1 is a home located in Contra Costa County with nearby schools including Meadow Homes Elementary School, Valley View Middle School, and Mt. Diablo High School.
Ownership History
Date
Name
Owned For
Owner Type
Purchase Details
Closed on
May 24, 2018
Sold by
Hilsabeck Frida
Bought by
Hilsabeck Frida A
Current Estimated Value
Purchase Details
Closed on
Apr 25, 2003
Sold by
Kolda Ryan B
Bought by
Kolda Ryan B
Purchase Details
Closed on
Sep 19, 2002
Sold by
Rising Phoenix Lp
Bought by
Kolda Ryan B
Home Financials for this Owner
Home Financials are based on the most recent Mortgage that was taken out on this home.
Original Mortgage
$318,750
Interest Rate
6.16%
Mortgage Type
Purchase Money Mortgage
Purchase Details
Closed on
Sep 19, 2000
Sold by
Louie Alvin S
Bought by
Rising Phoenix Lp
Purchase Details
Closed on
Jul 7, 2000
Sold by
Louie Alvin S
Bought by
Louie Alvin S
Purchase Details
Closed on
Jun 9, 1997
Sold by
Louie Wah Jung & Dixie Revocable Trust and Dixie
Bought by
Louie Dixie
Purchase Details
Closed on
Aug 31, 1994
Sold by
Louie Dixie Yeung
Bought by
Louie Wah Jung and Louie Dixie
Create a Home Valuation Report for This Property
The Home Valuation Report is an in-depth analysis detailing your home's value as well as a comparison with similar homes in the area
Home Values in the Area
Average Home Value in this Area
Purchase History
| Date | Buyer | Sale Price | Title Company |
|---|---|---|---|
| Hilsabeck Frida A | -- | None Available | |
| Hilsabeck Frida | -- | None Available | |
| Kolda Ryan B | -- | -- | |
| Kolda Ryan B | $425,000 | Old Republic Title | |
| Rising Phoenix Lp | -- | -- | |
| Louie Alvin S | -- | -- | |
| Louie Dixie | -- | -- | |
| Louie Wah Jung | -- | -- |
Source: Public Records
Mortgage History
| Date | Status | Borrower | Loan Amount |
|---|---|---|---|
| Closed | Kolda Ryan B | $318,750 |
Source: Public Records
Tax History Compared to Growth
Tax History
| Year | Tax Paid | Tax Assessment Tax Assessment Total Assessment is a certain percentage of the fair market value that is determined by local assessors to be the total taxable value of land and additions on the property. | Land | Improvement |
|---|---|---|---|---|
| 2025 | $11,677 | $753,114 | $301,241 | $451,873 |
| 2024 | $11,373 | $738,348 | $295,335 | $443,013 |
| 2023 | $11,373 | $723,872 | $289,545 | $434,327 |
| 2022 | $11,131 | $709,679 | $283,868 | $425,811 |
| 2021 | $10,784 | $695,764 | $278,302 | $417,462 |
| 2019 | $10,519 | $675,130 | $270,049 | $405,081 |
| 2018 | $10,043 | $661,893 | $264,754 | $397,139 |
| 2017 | $9,643 | $648,915 | $259,563 | $389,352 |
| 2016 | $9,303 | $636,192 | $254,474 | $381,718 |
| 2015 | $9,079 | $626,637 | $250,652 | $375,985 |
| 2014 | $7,973 | $540,000 | $215,900 | $324,100 |
Source: Public Records
Map
Nearby Homes
- 1771 Broadway St Unit 106
- 1771 Broadway St Unit 213
- 2170 Fremont St
- 1971 Bonifacio St Unit 6
- 1731 Ellis St Unit 16
- 1385 Galindo St
- 1591 Ellis St Unit 320
- 2142 Grant St
- 2251 Pacheco St
- 1700 Laguna St Unit B
- 1520 Detroit Ave
- 1680 Laguna St Unit H
- 2100 Laguna Cir Unit D
- 2600 Laguna Cir Unit G
- 1600 Laguna St Unit C
- 2000 Laguna Cir Unit D
- 1560 Pine St Unit 8
- 2343 Almond Ave
- 1439 Toyon Dr
- 2678 Mayfair Ave
- 1651 Sutter St Unit 3
- 1651 Sutter St
- 1651 Sutter St Unit 4
- 1651 Sutter St
- 1656 Broadway St Unit 1
- 1652 Broadway St Unit 1
- 1700 Broadway St
- 1771 Broadway St
- 1771 Broadway St Unit 328
- 1771 Broadway St Unit 327
- 1771 Broadway St Unit 326
- 1771 Broadway St Unit 325
- 1771 Broadway St Unit 324
- 1771 Broadway St Unit 323
- 1771 Broadway St Unit 322
- 1771 Broadway St Unit 321
- 1771 Broadway St Unit 320
- 1771 Broadway St Unit 200
- 1771 Broadway St Unit 128
- 1771 Broadway St Unit 127