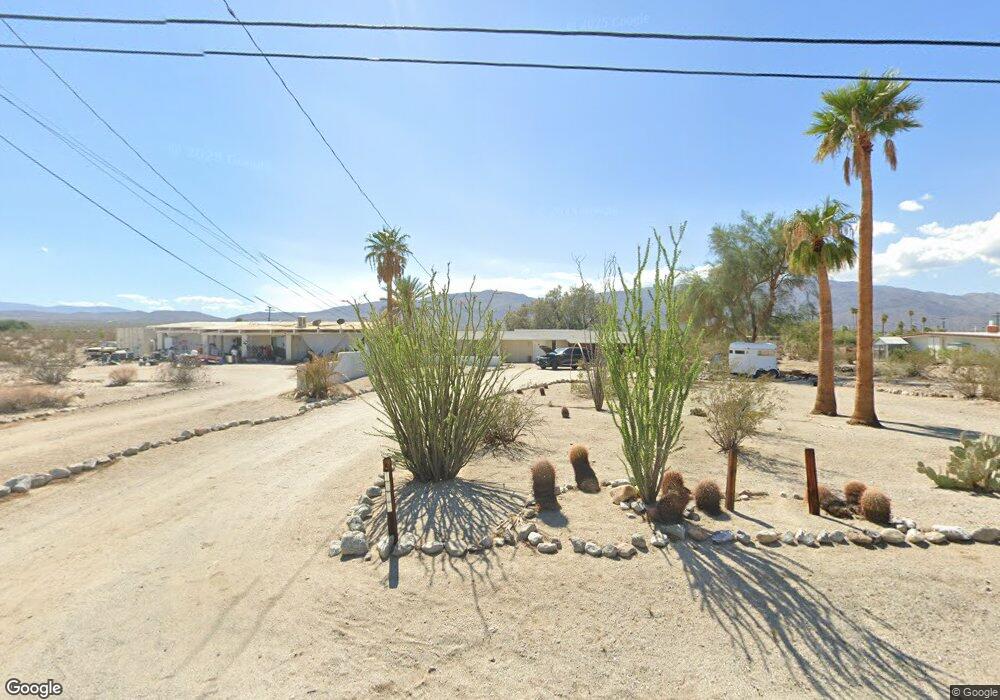
1655 Zuni Trail Borrego Springs, CA 92004
Estimated Value: $274,000 - $438,000
2
Beds
2
Baths
1,244
Sq Ft
$259/Sq Ft
Est. Value
About This Home
This home is located at 1655 Zuni Trail, Borrego Springs, CA 92004 and is currently estimated at $322,205, approximately $259 per square foot. 1655 Zuni Trail is a home located in San Diego County with nearby schools including Borrego Springs Elementary School, Borrego Springs Middle School, and Borrego Springs High School.
Ownership History
Date
Name
Owned For
Owner Type
Purchase Details
Closed on
May 14, 2015
Sold by
Ludwig Rick T and Helms David
Bought by
Hoagland Fuchs William and Hoagland Fuchs Nancy
Current Estimated Value
Home Financials for this Owner
Home Financials are based on the most recent Mortgage that was taken out on this home.
Original Mortgage
$94,900
Outstanding Balance
$73,451
Interest Rate
3.81%
Mortgage Type
New Conventional
Estimated Equity
$248,754
Purchase Details
Closed on
Sep 30, 2014
Sold by
Cramer Henry and Cramer Lanna Ludwig
Bought by
Helms David and Helms Janelle Ludwig
Purchase Details
Closed on
Jan 27, 2011
Sold by
Ludwig Frederick E and Ludwig Joanna C
Bought by
Helms Janelle and Helms David
Purchase Details
Closed on
Dec 29, 2000
Sold by
Ludwig Frederick E and Ludwig Joanna C
Bought by
Ludwig Rick T and Ludwig Paula
Purchase Details
Closed on
Jul 6, 1990
Purchase Details
Closed on
Dec 1, 1983
Create a Home Valuation Report for This Property
The Home Valuation Report is an in-depth analysis detailing your home's value as well as a comparison with similar homes in the area
Home Values in the Area
Average Home Value in this Area
Purchase History
| Date | Buyer | Sale Price | Title Company |
|---|---|---|---|
| Hoagland Fuchs William | $100,000 | Chicago Title | |
| Helms David | $15,000 | None Available | |
| Helms Janelle | -- | None Available | |
| Ludwig Rick T | -- | -- | |
| -- | $89,000 | -- | |
| -- | $63,000 | -- |
Source: Public Records
Mortgage History
| Date | Status | Borrower | Loan Amount |
|---|---|---|---|
| Open | Hoagland Fuchs William | $94,900 |
Source: Public Records
Tax History Compared to Growth
Tax History
| Year | Tax Paid | Tax Assessment Tax Assessment Total Assessment is a certain percentage of the fair market value that is determined by local assessors to be the total taxable value of land and additions on the property. | Land | Improvement |
|---|---|---|---|---|
| 2025 | $1,384 | $120,055 | $48,070 | $71,985 |
| 2024 | $1,384 | $117,702 | $47,128 | $70,574 |
| 2023 | $1,356 | $115,395 | $46,204 | $69,191 |
| 2022 | $1,337 | $113,134 | $45,299 | $67,835 |
| 2021 | $1,315 | $110,916 | $44,411 | $66,505 |
| 2020 | $1,311 | $109,780 | $43,956 | $65,824 |
| 2019 | $1,225 | $107,629 | $43,095 | $64,534 |
| 2018 | $1,203 | $105,519 | $42,250 | $63,269 |
| 2017 | $1,180 | $103,451 | $41,422 | $62,029 |
| 2016 | $1,155 | $101,423 | $40,610 | $60,813 |
| 2015 | $1,475 | $132,891 | $44,791 | $88,100 |
| 2014 | $1,450 | $130,932 | $44,131 | $86,801 |
Source: Public Records
Map
Nearby Homes
- 2 Borrego Springs Rd
- 1 Borrego Springs Rd
- 0 Way Unit 25571027IC
- 1451 Sewanee Dr
- 0 Sewanee Dr Unit PW25223640
- 0 Pecos Dr Unit PTP2507512
- 0 Pecos Dr Unit PTP2507511
- 0 Pecos Dr Unit PTP2507510
- 0 Pecos Dr Unit NDP2307189
- 3803 Pecos Dr
- 1.26 acres Indigo Ln Unit 14
- 1.26 acres Indigo Ln Unit 12
- 1.26 acres Indigo Ln Unit 11
- 1 Sarasota Dr
- 1410 Sewanee Dr
- 4949 Desert Vista Dr
- 0 Hunter Dr Unit 180056004
- 0 Hunter Dr Unit NDP2508112
- 1921 Desert Vista Terrace
- 1831 Hunter Dr
- 1659 Zuni Trail
- 1645 Zuni Trail
- 1669 Zuni Trail
- 1670 Zuni Trail
- 1634 Zuni Trail
- 1.49 Acre Hopi Path
- 1674 Zuni Trail
- 3836 Inca Rd
- 1678 Zuni Trail
- 1685 Zuni Trail
- 0 Zuni Trail Unit IV14227707
- 0 Zuni Trail Unit 150028993
- 15 Zuni Trail
- 0 Zuni Trail Unit 160042818
- 0 Zuni Trail Unit NDP2308919
- 0 Zuni Trail Unit 15 230010113
- 0 Zuni Trail Unit 8 140057640
- 0 Zuni Trail Unit 22 170044244
- 0 Zuni Trail Unit NDP2208713
- 0 Zuni Trail Unit 110037541