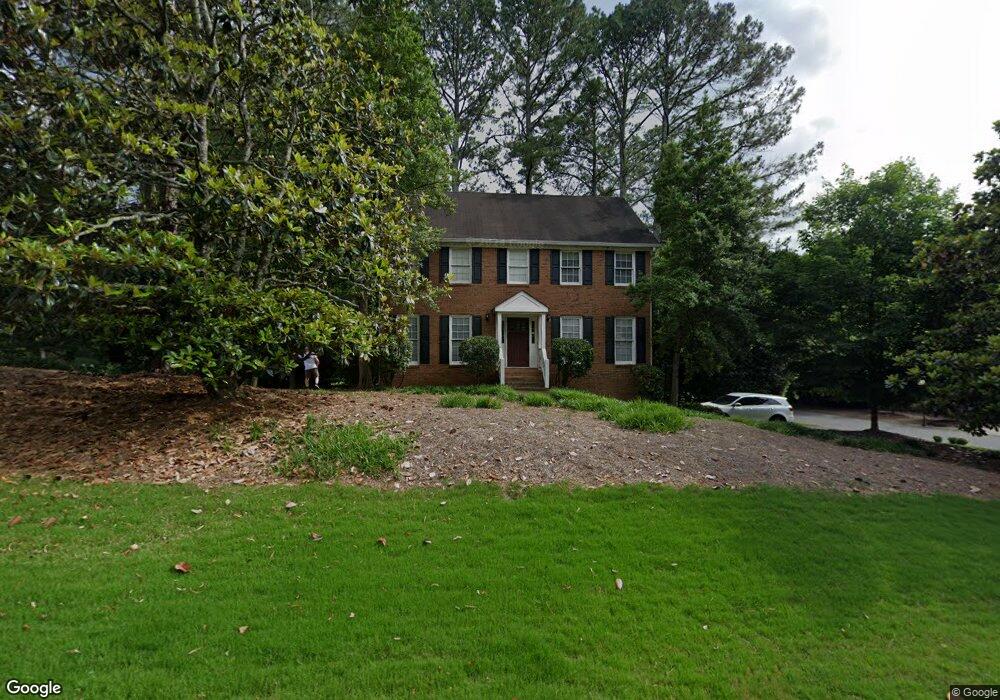
1656 Pinefield Rd Unit 2 Marietta, GA 30066
Sandy Plains NeighborhoodEstimated Value: $417,000 - $496,000
4
Beds
3
Baths
2,064
Sq Ft
$220/Sq Ft
Est. Value
About This Home
This home is located at 1656 Pinefield Rd Unit 2, Marietta, GA 30066 and is currently estimated at $454,230, approximately $220 per square foot. 1656 Pinefield Rd Unit 2 is a home located in Cobb County with nearby schools including Keheley Elementary School, McCleskey Middle School, and The Garden School.
Ownership History
Date
Name
Owned For
Owner Type
Purchase Details
Closed on
Nov 9, 2017
Sold by
The Bluffs At Jamerson Llc
Bought by
Odwyer Properties Llc
Current Estimated Value
Purchase Details
Closed on
Dec 15, 2000
Sold by
Delgetto Cathleen
Bought by
Reynolds Mark C and Reynolds Janette B
Home Financials for this Owner
Home Financials are based on the most recent Mortgage that was taken out on this home.
Original Mortgage
$125,000
Interest Rate
7.75%
Mortgage Type
New Conventional
Purchase Details
Closed on
Jan 12, 1999
Sold by
Kunitz Kaye
Bought by
Delgatto Cathleen
Purchase Details
Closed on
Apr 10, 1995
Sold by
Hardy James S Nancy D
Bought by
Kunitz Kate and Del Gatto Lewis
Create a Home Valuation Report for This Property
The Home Valuation Report is an in-depth analysis detailing your home's value as well as a comparison with similar homes in the area
Home Values in the Area
Average Home Value in this Area
Purchase History
| Date | Buyer | Sale Price | Title Company |
|---|---|---|---|
| Odwyer Properties Llc | -- | -- | |
| Reynolds Mark C | $164,800 | -- | |
| Delgatto Cathleen | -- | -- | |
| Kunitz Kate | $135,000 | -- |
Source: Public Records
Mortgage History
| Date | Status | Borrower | Loan Amount |
|---|---|---|---|
| Previous Owner | Reynolds Mark C | $125,000 | |
| Closed | Kunitz Kate | $0 |
Source: Public Records
Tax History Compared to Growth
Tax History
| Year | Tax Paid | Tax Assessment Tax Assessment Total Assessment is a certain percentage of the fair market value that is determined by local assessors to be the total taxable value of land and additions on the property. | Land | Improvement |
|---|---|---|---|---|
| 2025 | $1,250 | $163,828 | $36,000 | $127,828 |
| 2024 | $1,253 | $163,828 | $36,000 | $127,828 |
| 2023 | $1,047 | $163,828 | $36,000 | $127,828 |
| 2022 | $1,101 | $112,996 | $28,000 | $84,996 |
| 2021 | $1,101 | $112,996 | $28,000 | $84,996 |
| 2020 | $3,041 | $100,200 | $24,000 | $76,200 |
| 2019 | $3,041 | $100,200 | $24,000 | $76,200 |
| 2018 | $2,772 | $91,324 | $24,000 | $67,324 |
| 2017 | $2,626 | $91,324 | $24,000 | $67,324 |
| 2016 | $2,211 | $76,912 | $24,000 | $52,912 |
| 2015 | $2,101 | $71,300 | $24,000 | $47,300 |
| 2014 | $2,118 | $71,300 | $0 | $0 |
Source: Public Records
Map
Nearby Homes
- 4941 Willow Ln
- 156 W Oaks Place
- 5009 Kingsley Manor Ct
- 4924 Locklear Way
- 1877 Falcon Wood Dr NE
- 2899 Treeside Terrace
- 4791 Jamerson Forest Cir
- 4813 Highpoint Dr NE
- 226 Hames Rd Unit 405
- 226 Hames Rd Unit 225
- 1513 Jamerson Landing
- 4782 Jamerson Creek Ct
- 4758 Jamerson Forest Cir
- 1634 Barrier Rd
- 4680 Jamerson Forest Pkwy
- 4799 North Trail
- 4797 North Trail
- 1658 Pinefield Rd
- 1661 Pinefield Way Unit 2
- 1654 Pinefield Way
- 1657 Pinefield Rd
- 1660 Pinefield Rd
- 1659 Pinefield Rd
- 1660 Pinefield Way
- 1661 Pinefield Rd
- 1665 Pinefield Way
- 1667 Pinefield Way
- 1655 Pinefield Rd
- 0 Pinefield Rd Unit 7415773
- 0 Pinefield Rd Unit 8867683
- 0 Pinefield Rd Unit 8827039
- 0 Pinefield Rd Unit 7205018
- 0 Pinefield Rd Unit 7244862
- 1663 Pinefield Rd Unit 2/8
- 1663 Pinefield Rd
- 1664 Pinefield Rd
- 1662 Pinefield Way Unit II