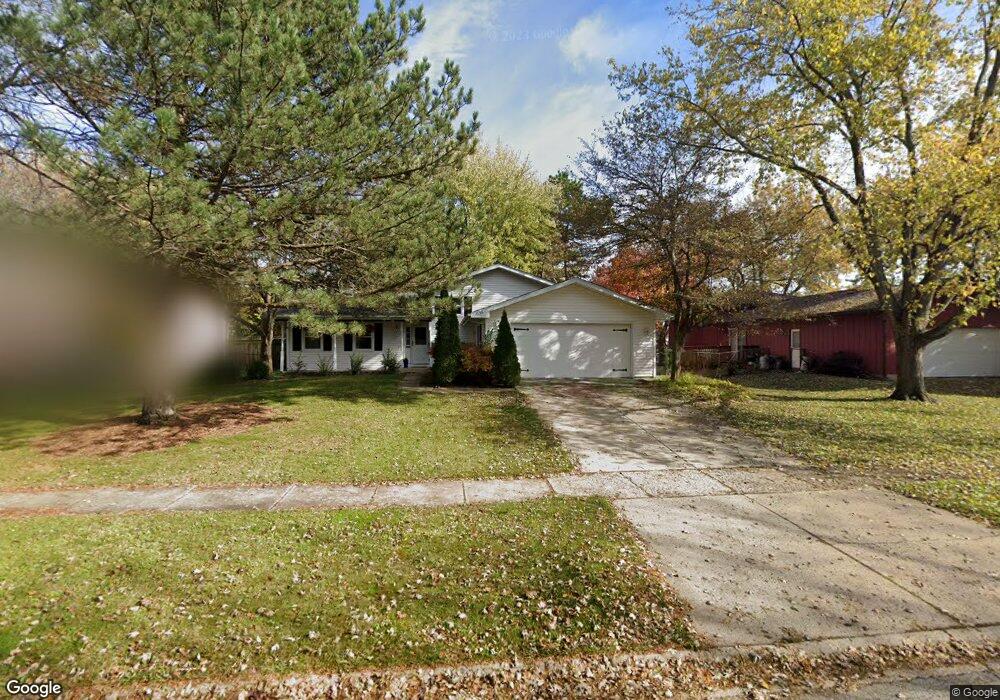
1656 Swallow St Naperville, IL 60565
Maple Brook NeighborhoodEstimated Value: $447,000 - $471,000
3
Beds
3
Baths
1,632
Sq Ft
$281/Sq Ft
Est. Value
About This Home
This home is located at 1656 Swallow St, Naperville, IL 60565 and is currently estimated at $458,033, approximately $280 per square foot. 1656 Swallow St is a home located in DuPage County with nearby schools including Maplebrook Elementary School, Lincoln Jr. High School, and Naperville Central High School.
Ownership History
Date
Name
Owned For
Owner Type
Purchase Details
Closed on
Jul 24, 2017
Sold by
Noorani Mehdi and Homertgen Mandana
Bought by
Mckendry Elizabeth and Nichol Kyle
Current Estimated Value
Home Financials for this Owner
Home Financials are based on the most recent Mortgage that was taken out on this home.
Original Mortgage
$247,500
Outstanding Balance
$207,634
Interest Rate
4.25%
Mortgage Type
New Conventional
Estimated Equity
$250,399
Purchase Details
Closed on
Feb 10, 2016
Sold by
Noorani Mehdi
Bought by
Mehdi Noorani Irrevocable Trust
Purchase Details
Closed on
Jun 3, 2015
Sold by
Noorani Mehdi and Noorani Parvin Biglari
Bought by
Noorani Mehdi
Purchase Details
Closed on
Feb 12, 2005
Sold by
Noorani Parvin Biglari and Noorani Mehdi
Bought by
Noorani Mehdi and Noorani Parvin Biglari
Purchase Details
Closed on
Mar 21, 2000
Sold by
Robert E Hill Trust
Bought by
Noorani Mehdi and Noorani Parvin Biglari
Create a Home Valuation Report for This Property
The Home Valuation Report is an in-depth analysis detailing your home's value as well as a comparison with similar homes in the area
Home Values in the Area
Average Home Value in this Area
Purchase History
| Date | Buyer | Sale Price | Title Company |
|---|---|---|---|
| Mckendry Elizabeth | -- | Citywide Title Corporation | |
| Mehdi Noorani Irrevocable Trust | -- | Attorney | |
| Noorani Mehdi | -- | Attorney | |
| Noorani Mehdi | -- | -- | |
| Noorani Mehdi | $180,000 | Chicago Title Insurance Co |
Source: Public Records
Mortgage History
| Date | Status | Borrower | Loan Amount |
|---|---|---|---|
| Open | Mckendry Elizabeth | $247,500 |
Source: Public Records
Tax History Compared to Growth
Tax History
| Year | Tax Paid | Tax Assessment Tax Assessment Total Assessment is a certain percentage of the fair market value that is determined by local assessors to be the total taxable value of land and additions on the property. | Land | Improvement |
|---|---|---|---|---|
| 2024 | $7,605 | $124,143 | $66,882 | $57,261 |
| 2023 | $7,362 | $113,300 | $61,040 | $52,260 |
| 2022 | $6,983 | $107,900 | $58,130 | $49,770 |
| 2021 | $6,739 | $103,820 | $55,930 | $47,890 |
| 2020 | $6,600 | $101,950 | $54,920 | $47,030 |
| 2019 | $6,420 | $97,540 | $52,540 | $45,000 |
| 2018 | $6,265 | $95,160 | $51,260 | $43,900 |
| 2017 | $6,149 | $91,950 | $49,530 | $42,420 |
| 2016 | $6,037 | $88,630 | $47,740 | $40,890 |
| 2015 | $6,017 | $83,470 | $44,960 | $38,510 |
| 2014 | $5,917 | $79,500 | $42,820 | $36,680 |
| 2013 | $5,828 | $79,690 | $42,920 | $36,770 |
Source: Public Records
Map
Nearby Homes
- 1751 S Washington St Unit 1
- 128 E Bailey Rd Unit G
- 138 E Bailey Rd Unit M
- 158 E Bailey Rd Unit F
- 1921 Wisteria Ct Unit 3
- 302 Carriage Hill Rd
- 621 Bourbon Ct
- 517 Sheffield Rd
- 213 Winding Creek Dr
- 1408 Swallow St
- 1449 Whitespire Ct Unit 5104
- 23 Glencoe Ct Unit 202B
- 47 Glencoe Ct Unit 102D
- 2132 Berkley Ct Unit 201A
- 336 Brooklea Ct
- 303 Cedarbrook Rd
- 1443 Meander Dr
- 8S452 Bell Dr
- 221 Hampshire Ct Unit 201D
- 2279 Kaskaskia Ct
- 1652 Swallow St
- 5 Redstart Rd
- 1648 Swallow St
- 1657 Swallow St
- 1644 Swallow St
- 1716 S Washington St Unit 1716
- 1712 S Washington St Unit 1712
- 1715 S Washington St Unit 1715
- 1711 S Washington St Unit 1711
- 1653 Swallow St
- 1713 S Washington St Unit 1713
- 1718 S Washington St Unit 1718
- 1717 S Washington St Unit 1717
- 1714 S Washington St Unit 1714
- 9 Redstart Rd
- 1649 Swallow St
- 1640 Swallow St
- 8 Redstart Rd
- 1645 Swallow St
- 1731 S Washington St Unit 1731