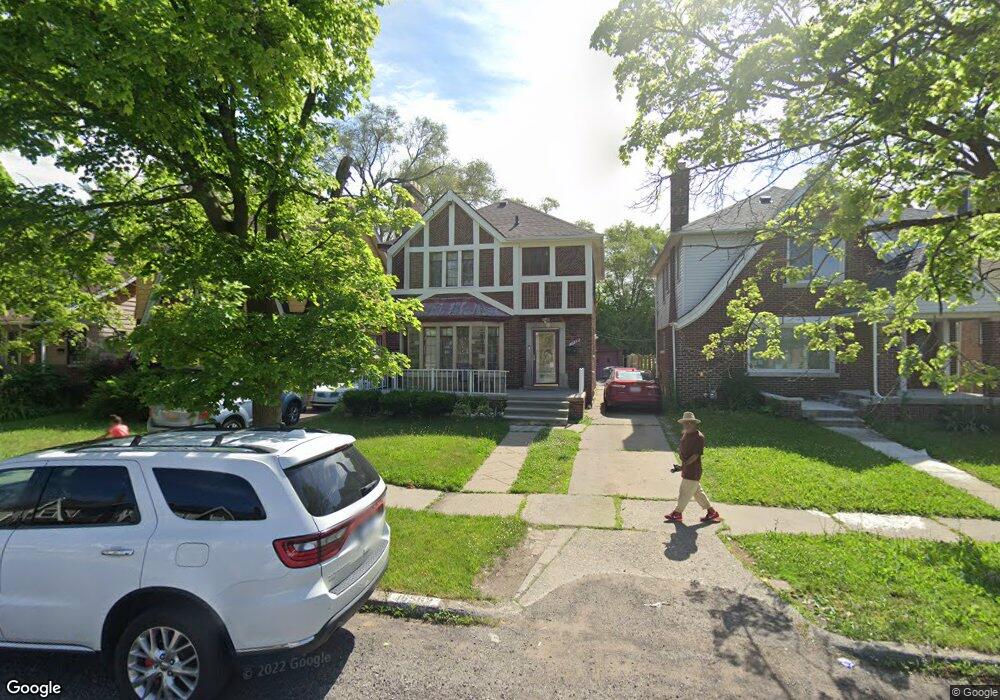
16562 Muirland St Detroit, MI 48221
Martin Park NeighborhoodEstimated Value: $151,152 - $238,000
3
Beds
2
Baths
1,583
Sq Ft
$126/Sq Ft
Est. Value
About This Home
This home is located at 16562 Muirland St, Detroit, MI 48221 and is currently estimated at $198,788, approximately $125 per square foot. 16562 Muirland St is a home located in Wayne County with nearby schools including Paul Robeson Malcolm X Academy, Charles L. Spain Elementary-Middle School, and Edward 'Duke' Ellington Conservatory of Music and Art.
Ownership History
Date
Name
Owned For
Owner Type
Purchase Details
Closed on
Mar 2, 2017
Sold by
Full Gospel Opendoor Assemblies Inc
Bought by
Dammar Elaine
Current Estimated Value
Purchase Details
Closed on
Feb 10, 2016
Sold by
Dunkley Yvonne
Bought by
Dammar Elaine
Purchase Details
Closed on
Dec 5, 2014
Sold by
Dunkley Yvonne
Bought by
Sewell Michael
Purchase Details
Closed on
Jul 28, 2012
Sold by
Sewell Michael
Bought by
Dunkley Yvonne
Purchase Details
Closed on
Nov 17, 2011
Sold by
Wojtowicz Raymond J
Bought by
Sewell Michael
Purchase Details
Closed on
Mar 5, 2009
Sold by
Sewell Michael
Bought by
Sewell Hazel
Purchase Details
Closed on
Nov 14, 2007
Sold by
Stokes Wendell and Stokes Sheila
Bought by
Reo Properties Corp
Purchase Details
Closed on
Sep 7, 2005
Sold by
Johnson Derrick W and Johnson Robin M
Bought by
Stokes Wendell
Purchase Details
Closed on
Jan 16, 1998
Sold by
Ashby John D
Bought by
Johnson Derrick W
Create a Home Valuation Report for This Property
The Home Valuation Report is an in-depth analysis detailing your home's value as well as a comparison with similar homes in the area
Home Values in the Area
Average Home Value in this Area
Purchase History
| Date | Buyer | Sale Price | Title Company |
|---|---|---|---|
| Dammar Elaine | -- | None Available | |
| Dammar Elaine | -- | Attorney | |
| Sewell Michael | -- | None Available | |
| Dunkley Yvonne | -- | None Available | |
| Sewell Michael | $7,555 | None Available | |
| Sewell Hazel | -- | None Available | |
| Reo Properties Corp | $167,019 | None Available | |
| Stokes Wendell | $170,000 | Clearly Title | |
| Johnson Derrick W | $99,000 | -- |
Source: Public Records
Tax History Compared to Growth
Tax History
| Year | Tax Paid | Tax Assessment Tax Assessment Total Assessment is a certain percentage of the fair market value that is determined by local assessors to be the total taxable value of land and additions on the property. | Land | Improvement |
|---|---|---|---|---|
| 2025 | $1,257 | $45,900 | $0 | $0 |
| 2024 | $1,257 | $38,200 | $0 | $0 |
| 2023 | $1,220 | $30,000 | $0 | $0 |
| 2022 | $1,300 | $27,100 | $0 | $0 |
| 2021 | $1,265 | $20,700 | $0 | $0 |
| 2020 | $1,265 | $17,800 | $0 | $0 |
| 2019 | $1,246 | $13,300 | $0 | $0 |
| 2018 | $1,095 | $11,100 | $0 | $0 |
| 2017 | $211 | $11,100 | $0 | $0 |
| 2016 | $1,797 | $22,100 | $0 | $0 |
| 2015 | $2,060 | $20,600 | $0 | $0 |
| 2013 | $3,303 | $33,028 | $0 | $0 |
| 2010 | -- | $45,843 | $910 | $44,933 |
Source: Public Records
Map
Nearby Homes
- 16239 Muirland St
- 16554 Muirland St
- 16211 Muirland St
- 16533 Parkside St
- 16182 Fairfield St
- 16167 Muirland St
- 16532 Parkside St
- 16126 Dexter Ave
- 16631 Lawton St
- 16834 Muirland St
- 16200 Lawton St
- 16651 Lawton St
- 15904 Muirland St
- 16831 Lawton St
- 16133 Princeton St
- 16182 Princeton St
- 7126 Puritan Ave
- 7147 Puritan Ave
- 7419 Puritan Ave
- 16936 Fairfield St
- 16568 Muirland St
- 16574 Muirland St
- 16546 Muirland St
- 16540 Muirland St
- 16586 Muirland St
- 16532 Muirland St
- 16563 Wildemere St
- 16585 Wildemere St
- 16569 Wildemere St
- 16555 Wildemere St
- 16575 Wildemere St
- 16547 Wildemere St
- 16526 Muirland St
- 16535 Wildemere St
- 16596 Muirland St
- 16541 Wildemere St
- 16563 Muirland St Unit Bldg-Unit
- 16563 Muirland St
- 16547 Muirland St
- 16577 Muirland St