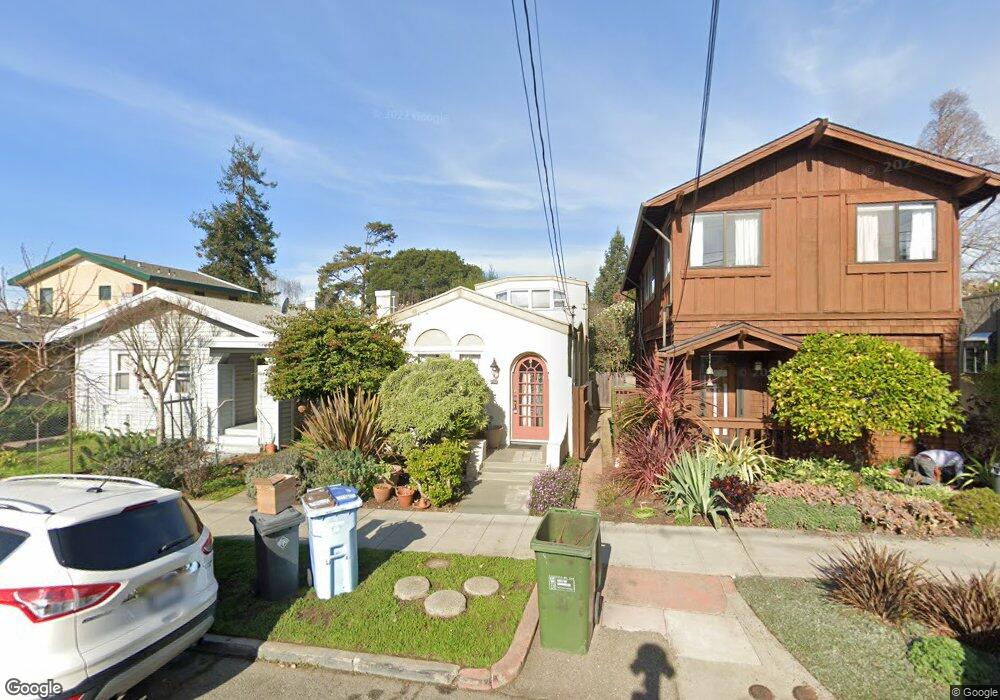
1657 Capistrano Ave Berkeley, CA 94707
Thousand Oaks NeighborhoodEstimated Value: $985,000 - $1,523,000
2
Beds
1
Bath
1,099
Sq Ft
$1,146/Sq Ft
Est. Value
About This Home
This home is located at 1657 Capistrano Ave, Berkeley, CA 94707 and is currently estimated at $1,259,030, approximately $1,145 per square foot. 1657 Capistrano Ave is a home located in Alameda County with nearby schools including Thousand Oaks Elementary School, Ruth Acty Elementary, and Berkeley Arts Magnet at Whittier School.
Ownership History
Date
Name
Owned For
Owner Type
Purchase Details
Closed on
Aug 11, 2023
Sold by
Kellison Blair C
Bought by
Kellison Living Trust and Kellison
Current Estimated Value
Purchase Details
Closed on
Oct 22, 2021
Sold by
Kellison Laura J
Bought by
Kellison Blair C
Purchase Details
Closed on
Oct 18, 2021
Sold by
Kellison Family 2014 Revocable Intervivo and Kellison Blair C
Bought by
Kellison Blair C and Kellison Laura J
Purchase Details
Closed on
Jan 17, 2006
Sold by
Demoss Diane M
Bought by
Kellison Blair C and Kellison Laura J
Home Financials for this Owner
Home Financials are based on the most recent Mortgage that was taken out on this home.
Original Mortgage
$462,000
Interest Rate
6.32%
Mortgage Type
Purchase Money Mortgage
Create a Home Valuation Report for This Property
The Home Valuation Report is an in-depth analysis detailing your home's value as well as a comparison with similar homes in the area
Home Values in the Area
Average Home Value in this Area
Purchase History
| Date | Buyer | Sale Price | Title Company |
|---|---|---|---|
| Kellison Living Trust | -- | None Listed On Document | |
| Kellison Blair C | -- | None Available | |
| Kellison Blair C | -- | None Listed On Document | |
| Kellison Blair C | $577,500 | Placer Title Company |
Source: Public Records
Mortgage History
| Date | Status | Borrower | Loan Amount |
|---|---|---|---|
| Previous Owner | Kellison Blair C | $462,000 |
Source: Public Records
Tax History
| Year | Tax Paid | Tax Assessment Tax Assessment Total Assessment is a certain percentage of the fair market value that is determined by local assessors to be the total taxable value of land and additions on the property. | Land | Improvement |
|---|---|---|---|---|
| 2025 | $11,345 | $789,130 | $236,739 | $552,391 |
| 2024 | $11,345 | $773,658 | $232,097 | $541,561 |
| 2023 | $11,118 | $758,493 | $227,548 | $530,945 |
| 2022 | $10,939 | $743,623 | $223,087 | $520,536 |
| 2021 | $10,977 | $729,047 | $218,714 | $510,333 |
| 2020 | $10,447 | $721,574 | $216,472 | $505,102 |
| 2019 | $10,099 | $707,431 | $212,229 | $495,202 |
| 2018 | $9,943 | $693,565 | $208,069 | $485,496 |
| 2017 | $9,597 | $679,971 | $203,991 | $475,980 |
| 2016 | $9,330 | $666,642 | $199,992 | $466,650 |
| 2015 | $9,213 | $656,634 | $196,990 | $459,644 |
| 2014 | $9,166 | $643,773 | $193,132 | $450,641 |
Source: Public Records
Map
Nearby Homes
- 753 Peralta Ave
- 731 Santa fe Ave
- 1498 Sonoma Ave
- 415 Berkeley Park Blvd
- 1983 Yosemite Rd
- 840 Key Route Blvd
- 1266 Washington Ave
- 1036 Ramona Ave
- 118 Ramona Ave
- 712 Masonic Ave
- 1236 Portland Ave
- 765 San Diego Rd
- 1120 Curtis St
- 145 Ramona Ave
- 1127 Key Route Blvd
- 813 San Diego Rd
- 1950 Hopkins St
- 589 San Luis Rd
- 1626 Hopkins St
- 826 Indian Rock Ave
- 1661 Capistrano Ave
- 1653 Capistrano Ave
- 1669 Capistrano Ave
- 1645 Capistrano Ave
- 1675 Capistrano Ave
- 1668 San Lorenzo Ave
- 1635 Capistrano Ave
- 1692 San Lorenzo Ave
- 1681 Capistrano Ave
- 811 Miramar Ave
- 1660 Capistrano Ave
- 819 Miramar Ave
- 1654 Capistrano Ave
- 1662 San Lorenzo Ave
- 1668 Capistrano Ave
- 1644 Capistrano Ave
- 825 Miramar Ave
- 1698 San Lorenzo Ave
- 1674 Capistrano Ave
- 824 Ensenada Ave
Your Personal Tour Guide
Ask me questions while you tour the home.