1657 I St Sparks, NV 89431
Downtown Sparks NeighborhoodEstimated Value: $403,000 - $524,000
4
Beds
2
Baths
1,688
Sq Ft
$276/Sq Ft
Est. Value
About This Home
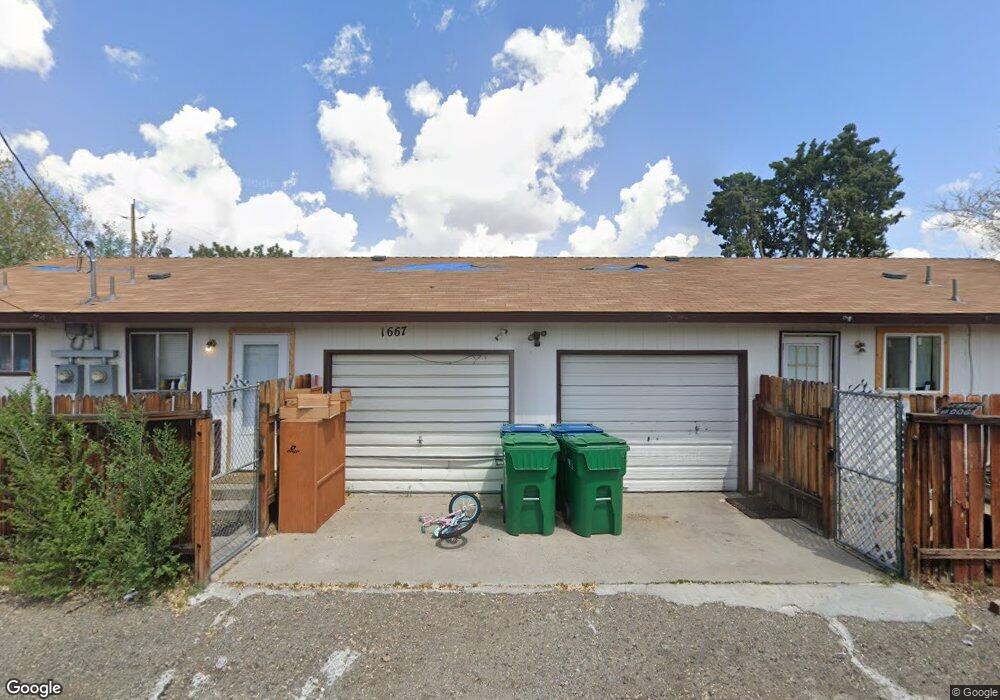
This home is located at 1657 I St, Sparks, NV 89431 and is currently estimated at $466,367, approximately $276 per square foot. 1657 I St is a home located in Washoe County with nearby schools including Robert Mitchell Elementary School, Sparks Middle School, and Sparks High School.
Ownership History
Date
Name
Owned For
Owner Type
Purchase Details
Closed on
Apr 28, 2021
Sold by
Milabar Gary and Sperle Laurie
Bought by
Fuentes Maria Teresa
Current Estimated Value
Home Financials for this Owner
Home Financials are based on the most recent Mortgage that was taken out on this home.
Original Mortgage
$319,014
Outstanding Balance
$288,654
Interest Rate
3%
Mortgage Type
FHA
Estimated Equity
$177,713
Purchase Details
Closed on
Mar 5, 2021
Sold by
Sperle Laurie and Estate Of Dennis W Milabar
Bought by
Milabar Gary and Sperle Laurie
Home Financials for this Owner
Home Financials are based on the most recent Mortgage that was taken out on this home.
Original Mortgage
$319,014
Outstanding Balance
$288,654
Interest Rate
3%
Mortgage Type
FHA
Estimated Equity
$177,713
Purchase Details
Closed on
Jun 20, 2012
Sold by
Milabar Gary and Milabar Dennis
Bought by
Milabar Dennis
Purchase Details
Closed on
Mar 29, 1996
Sold by
Fitzgerald Gertrude and Milabar Rudy F
Bought by
Milabar Rudy F
Create a Home Valuation Report for This Property
The Home Valuation Report is an in-depth analysis detailing your home's value as well as a comparison with similar homes in the area
Home Values in the Area
Average Home Value in this Area
Purchase History
| Date | Buyer | Sale Price | Title Company |
|---|---|---|---|
| Fuentes Maria Teresa | $324,900 | First Centennial Reno | |
| Milabar Gary | $108,445 | None Available | |
| Milabar Dennis | -- | None Available | |
| Milabar Rudy F | -- | -- |
Source: Public Records
Mortgage History
| Date | Status | Borrower | Loan Amount |
|---|---|---|---|
| Open | Fuentes Maria Teresa | $319,014 |
Source: Public Records
Tax History Compared to Growth
Tax History
| Year | Tax Paid | Tax Assessment Tax Assessment Total Assessment is a certain percentage of the fair market value that is determined by local assessors to be the total taxable value of land and additions on the property. | Land | Improvement |
|---|---|---|---|---|
| 2025 | $2,968 | $58,787 | $39,634 | $19,153 |
| 2024 | $2,907 | $56,109 | $36,775 | $19,334 |
| 2023 | $2,907 | $54,019 | $37,340 | $16,680 |
| 2022 | $2,110 | $45,344 | $31,222 | $14,123 |
| 2021 | $966 | $37,956 | $24,106 | $13,850 |
| 2020 | $1,426 | $38,598 | $24,938 | $13,660 |
| 2019 | $2,509 | $34,316 | $21,347 | $12,969 |
| 2018 | $824 | $26,837 | $14,431 | $12,406 |
| 2017 | $791 | $26,111 | $13,300 | $12,811 |
| 2016 | $771 | $24,116 | $10,640 | $13,476 |
| 2015 | $769 | $21,866 | $7,648 | $14,218 |
| 2014 | $745 | $20,614 | $6,650 | $13,964 |
| 2013 | -- | $20,004 | $5,852 | $14,152 |
Source: Public Records
Map
Nearby Homes