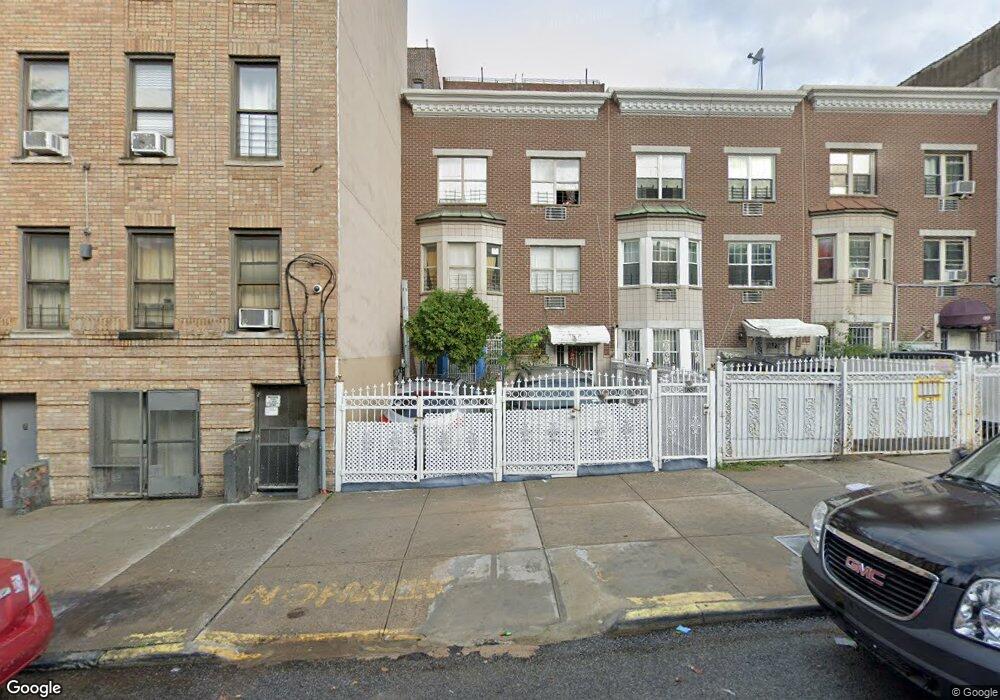
1657 Nelson Ave Bronx, NY 10453
Morris Heights NeighborhoodEstimated Value: $964,000 - $1,241,000
Studio
--
Bath
3,036
Sq Ft
$368/Sq Ft
Est. Value
About This Home
This home is located at 1657 Nelson Ave, Bronx, NY 10453 and is currently estimated at $1,118,333, approximately $368 per square foot. 1657 Nelson Ave is a home located in Bronx County with nearby schools including P.S. 199 The Shakespeare School, CIS 303: Leadership & Community Service Academy/232, and I.S. 232 The Alexander Macomb School.
Ownership History
Date
Name
Owned For
Owner Type
Purchase Details
Closed on
Aug 16, 2021
Sold by
Ogando Bienvenido
Bought by
Ogando Bienvenido and Ogando Linda R
Current Estimated Value
Purchase Details
Closed on
Oct 27, 2003
Sold by
Gonzalez William and Ogando Bienvenido
Bought by
Ogando Bienvenido
Home Financials for this Owner
Home Financials are based on the most recent Mortgage that was taken out on this home.
Original Mortgage
$203,700
Outstanding Balance
$93,521
Interest Rate
6.09%
Mortgage Type
Purchase Money Mortgage
Estimated Equity
$1,024,812
Create a Home Valuation Report for This Property
The Home Valuation Report is an in-depth analysis detailing your home's value as well as a comparison with similar homes in the area
Home Values in the Area
Average Home Value in this Area
Purchase History
| Date | Buyer | Sale Price | Title Company |
|---|---|---|---|
| Ogando Bienvenido | -- | -- | |
| Ogando Bienvenido | -- | -- | |
| Ogando Bienvenido | -- | -- | |
| Ogando Bienvenido | -- | -- |
Source: Public Records
Mortgage History
| Date | Status | Borrower | Loan Amount |
|---|---|---|---|
| Open | Ogando Bienvenido | $203,700 | |
| Closed | Ogando Bienvenido | $203,700 |
Source: Public Records
Tax History
| Year | Tax Paid | Tax Assessment Tax Assessment Total Assessment is a certain percentage of the fair market value that is determined by local assessors to be the total taxable value of land and additions on the property. | Land | Improvement |
|---|---|---|---|---|
| 2025 | $6,129 | $31,916 | $6,792 | $25,124 |
| 2024 | $6,129 | $31,915 | $6,831 | $25,084 |
| 2023 | $6,148 | $31,674 | $5,891 | $25,783 |
| 2022 | $5,678 | $50,400 | $11,160 | $39,240 |
| 2021 | $5,630 | $40,920 | $11,160 | $29,760 |
| 2020 | $5,334 | $39,960 | $11,160 | $28,800 |
| 2019 | $4,881 | $35,880 | $11,160 | $24,720 |
| 2018 | $4,324 | $26,395 | $7,780 | $18,615 |
| 2017 | $3,782 | $24,901 | $8,641 | $16,260 |
| 2016 | $3,201 | $23,493 | $8,666 | $14,827 |
| 2015 | $1,214 | $22,164 | $7,337 | $14,827 |
| 2014 | $1,214 | $22,164 | $7,337 | $14,827 |
Source: Public Records
Map
Nearby Homes
- 1715 Nelson Ave Unit 4F
- 1715 Nelson Ave Unit 4H
- 1715 Nelson Ave Unit 2D
- 140 W 175th St
- 1623 Undercliff Ave
- 1703 Townsend Ave
- 1800 Palisade Place
- 1802 Palisade Place
- 1819 Palisade Place
- 1855 Harrison Ave
- 1862 University Ave
- 1389 Shakespeare Ave
- 1383 Plimpton Ave Unit 5B
- 1372 Shakespeare Ave Unit 2H
- 1800 Grand Concourse
- 1748 Eastburn Ave
- 1917 Loring Place S
- 1855 Grand Concourse Unit 6
- 1855 Grand Concourse Unit 26
- 1855 Grand Concourse Unit 1
- 1659 Nelson Ave
- 1659 Nelson Ave Unit 3
- 1659 Nelson Ave Unit 2
- 1659 Nelson Ave Unit 1
- 1661 Nelson Ave
- 1643-1657 Nelson Ave
- 1651 Nelson Ave Unit B-3
- 1665 Nelson Ave
- 1640 Dr Martin l King jr Blvd
- 1636 Dr Martin l King jr Blvd
- 1646 Dr Martin l King jr Blvd
- 1667 Nelson Ave Unit Building
- 1667 Nelson Ave
- 1656 Nelson Ave
- 1671 Nelson Ave
- 1641 Nelson Ave
- 1652 Dr Martin l King jr Blvd
- 1632 Dr Martin l King jr Blvd
- 1662 Nelson Ave
- 1664 Nelson Ave
Your Personal Tour Guide
Ask me questions while you tour the home.