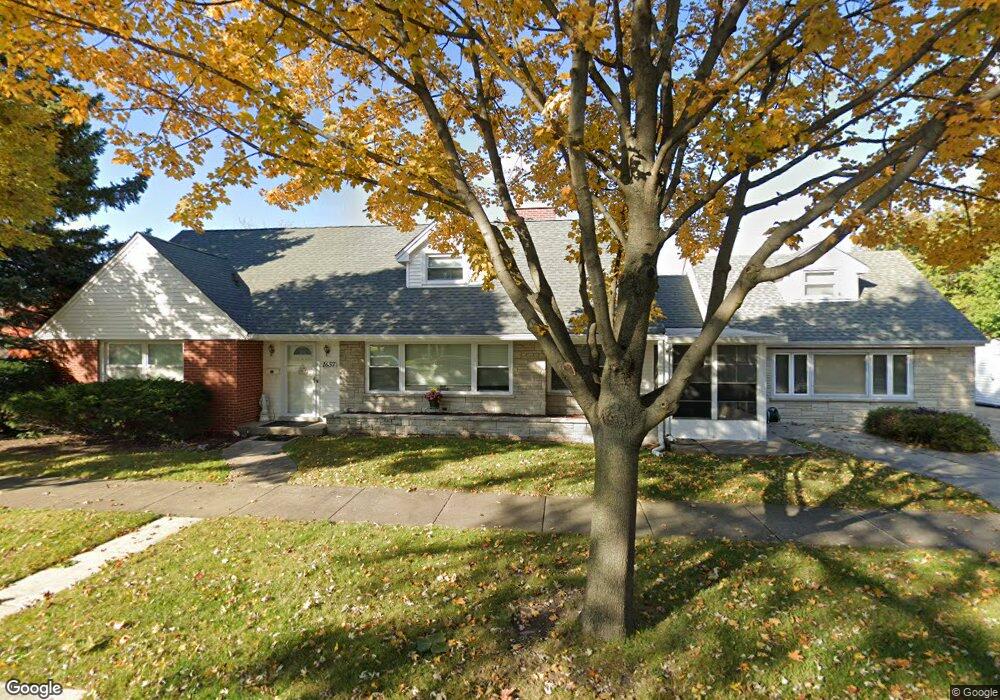
1657 Norfolk Ave Westchester, IL 60154
Estimated Value: $419,000 - $510,000
4
Beds
3
Baths
3,155
Sq Ft
$148/Sq Ft
Est. Value
About This Home
This home is located at 1657 Norfolk Ave, Westchester, IL 60154 and is currently estimated at $465,993, approximately $147 per square foot. 1657 Norfolk Ave is a home located in Cook County with nearby schools including Westchester Primary School, Westchester Intermediate School, and Westchester Middle School.
Ownership History
Date
Name
Owned For
Owner Type
Purchase Details
Closed on
Jul 11, 1997
Sold by
Silvestri Christopher D
Bought by
Richards Betty J and Richards Caputo Lorraine E
Current Estimated Value
Home Financials for this Owner
Home Financials are based on the most recent Mortgage that was taken out on this home.
Original Mortgage
$98,000
Outstanding Balance
$13,119
Interest Rate
6.75%
Estimated Equity
$452,874
Purchase Details
Closed on
Jan 9, 1995
Sold by
Sawyers Donald L
Bought by
Silvestri Christopher D
Home Financials for this Owner
Home Financials are based on the most recent Mortgage that was taken out on this home.
Original Mortgage
$174,800
Interest Rate
8.75%
Purchase Details
Closed on
Sep 15, 1993
Sold by
Sawyers Donald L
Bought by
Sawyers Donald L and Donald L Sawyers Revocable Trust
Create a Home Valuation Report for This Property
The Home Valuation Report is an in-depth analysis detailing your home's value as well as a comparison with similar homes in the area
Home Values in the Area
Average Home Value in this Area
Purchase History
| Date | Buyer | Sale Price | Title Company |
|---|---|---|---|
| Richards Betty J | $193,000 | -- | |
| Richards Betty J | -- | -- | |
| Richards Betty J | -- | -- | |
| Silvestri Christopher D | $184,000 | -- | |
| Sawyers Donald L | -- | -- |
Source: Public Records
Mortgage History
| Date | Status | Borrower | Loan Amount |
|---|---|---|---|
| Open | Richards Betty J | $98,000 | |
| Previous Owner | Silvestri Christopher D | $174,800 |
Source: Public Records
Tax History Compared to Growth
Tax History
| Year | Tax Paid | Tax Assessment Tax Assessment Total Assessment is a certain percentage of the fair market value that is determined by local assessors to be the total taxable value of land and additions on the property. | Land | Improvement |
|---|---|---|---|---|
| 2024 | $8,315 | $35,000 | $4,671 | $30,329 |
| 2023 | $6,857 | $35,000 | $4,671 | $30,329 |
| 2022 | $6,857 | $29,318 | $4,004 | $25,314 |
| 2021 | $7,674 | $29,317 | $4,003 | $25,314 |
| 2020 | $7,564 | $29,317 | $4,003 | $25,314 |
| 2019 | $8,415 | $33,216 | $3,670 | $29,546 |
| 2018 | $8,303 | $33,216 | $3,670 | $29,546 |
| 2017 | $6,371 | $25,829 | $3,670 | $22,159 |
| 2016 | $7,143 | $26,990 | $3,336 | $23,654 |
| 2015 | $7,015 | $26,990 | $3,336 | $23,654 |
| 2014 | $6,869 | $26,990 | $3,336 | $23,654 |
| 2013 | $6,299 | $27,686 | $3,336 | $24,350 |
Source: Public Records
Map
Nearby Homes
- 1623 Manchester Ave
- 1601 Bristol Ave
- 1900 Manchester Ave
- 1840 Gardner Rd
- 1907 Suffolk Ave
- 1500 Bristol Ave
- 1433 Bristol Ave
- 1932 Newcastle Ave
- 2128 Hull Ave
- 10072 Drury Ln
- 1119 Newcastle Ave
- 2320 S 22nd Ave
- 1247 S Mannheim Rd Unit 3
- 1016 Hull Ave
- 923 Manchester Ave
- 920 Suffolk Ave
- 10531 Camelot St
- 2237 S 22nd Ave
- 10524 Camelot St
- 2428 S 19th Ave
- 1653 Norfolk Ave
- 1647 Norfolk Ave
- 1803 Norfolk Ave
- 1656 Manchester Ave
- 1652 Manchester Ave
- 1643 Norfolk Ave
- 1646 Manchester Ave
- 1807 Norfolk Ave
- 1800 Manchester Ave
- 1637 Norfolk Ave
- 1642 Manchester Ave
- 1806 Manchester Ave
- 1813 Norfolk Ave
- 1800 Norfolk Ave
- 1636 Manchester Ave
- 1631 Norfolk Ave
- 1806 Norfolk Ave
- 1812 Manchester Ave
- 1817 Norfolk Ave
- 1632 Manchester Ave