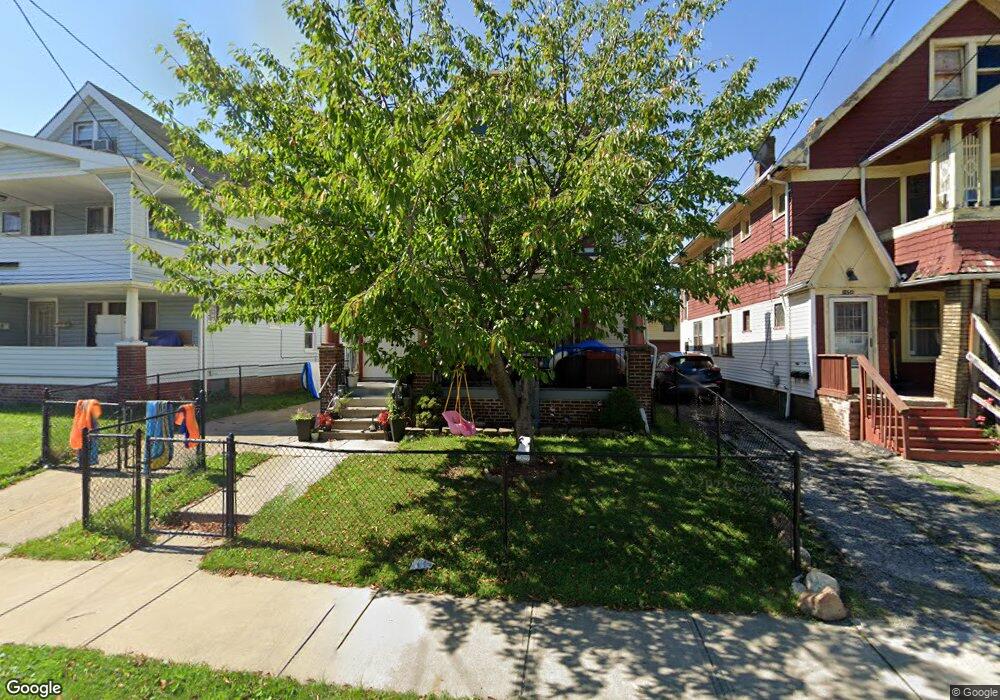
1658 Catalpa Rd Cleveland, OH 44112
Euclid-Green NeighborhoodEstimated Value: $86,000 - $158,000
4
Beds
2
Baths
2,070
Sq Ft
$53/Sq Ft
Est. Value
About This Home
This home is located at 1658 Catalpa Rd, Cleveland, OH 44112 and is currently estimated at $109,424, approximately $52 per square foot. 1658 Catalpa Rd is a home located in Cuyahoga County with nearby schools including Bolton, Anton Grdina School, and Adlai Stevenson School.
Ownership History
Date
Name
Owned For
Owner Type
Purchase Details
Closed on
Aug 2, 2000
Sold by
Cleveland Housing Network Inc
Bought by
Jackson Tracy M
Current Estimated Value
Home Financials for this Owner
Home Financials are based on the most recent Mortgage that was taken out on this home.
Original Mortgage
$81,725
Outstanding Balance
$29,570
Interest Rate
8.19%
Estimated Equity
$79,854
Purchase Details
Closed on
Oct 18, 1999
Sold by
Hud
Bought by
Cleveland Housing Network Inc
Purchase Details
Closed on
Oct 16, 1998
Sold by
Hozian Michael W
Bought by
Hud
Purchase Details
Closed on
Aug 10, 1990
Sold by
Rinn Rose Zavarella
Bought by
Michael W Hozian
Purchase Details
Closed on
Oct 2, 1987
Sold by
Rynkowski Edwin F and Rynkowski Rose C
Bought by
Rinn Rose Zavarella
Purchase Details
Closed on
Jan 1, 1975
Bought by
Rynkowski Edwin F and Rynkowski Rose C
Create a Home Valuation Report for This Property
The Home Valuation Report is an in-depth analysis detailing your home's value as well as a comparison with similar homes in the area
Home Values in the Area
Average Home Value in this Area
Purchase History
| Date | Buyer | Sale Price | Title Company |
|---|---|---|---|
| Jackson Tracy M | $92,500 | Rockwell Title Agency Inc | |
| Cleveland Housing Network Inc | $22,000 | Gateway Title Agency Inc | |
| Hud | $28,500 | U S Title Agency Inc | |
| Michael W Hozian | $31,000 | -- | |
| Rinn Rose Zavarella | -- | -- | |
| Rynkowski Edwin F | -- | -- |
Source: Public Records
Mortgage History
| Date | Status | Borrower | Loan Amount |
|---|---|---|---|
| Open | Jackson Tracy M | $81,725 | |
| Closed | Jackson Tracy M | $10,000 |
Source: Public Records
Tax History Compared to Growth
Tax History
| Year | Tax Paid | Tax Assessment Tax Assessment Total Assessment is a certain percentage of the fair market value that is determined by local assessors to be the total taxable value of land and additions on the property. | Land | Improvement |
|---|---|---|---|---|
| 2024 | $1,491 | $22,750 | $3,990 | $18,760 |
| 2023 | $1,028 | $13,550 | $1,610 | $11,940 |
| 2022 | $1,802 | $13,545 | $1,610 | $11,935 |
| 2021 | $1,012 | $13,550 | $1,610 | $11,940 |
| 2020 | $973 | $11,270 | $1,330 | $9,940 |
| 2019 | $900 | $32,200 | $3,800 | $28,400 |
| 2018 | $940 | $11,270 | $1,330 | $9,940 |
| 2017 | $990 | $12,010 | $670 | $11,340 |
| 2016 | $983 | $12,010 | $670 | $11,340 |
| 2015 | $2,841 | $12,010 | $670 | $11,340 |
| 2014 | $2,841 | $12,390 | $700 | $11,690 |
Source: Public Records
Map
Nearby Homes
- 1707 Catalpa Rd
- 1617 Catalpa Rd
- 1651 Avalon Rd
- 1639 Avalon Rd
- 1646 Avalon Rd
- 1777 Catalpa Rd
- 1682 Cliffview Rd
- 1547 E 173rd St
- 1738 Cliffview Rd
- 18001 Olympia Rd
- 1738 Burgess Rd
- 1677 Hillview Rd
- 1563 Clermont Rd
- 19151 Genesee Rd
- 1445 E 172nd St
- 1477 E 195th St
- 1426 E 175th St
- 16519 Burnside Ave
- 940 London Rd
- 1443 Larchmont Rd
- 1656 Catalpa Rd
- 1662 Catalpa Rd
- 1650 Catalpa Rd
- 1666 Catalpa Rd
- 1646 Catalpa Rd
- 1670 Catalpa Rd
- 1642 Catalpa Rd
- 1676 Catalpa Rd
- 1659 Catalpa Rd
- 1655 Catalpa Rd
- 1663 Catalpa Rd
- 1651 Catalpa Rd
- 1667 Catalpa Rd
- 1671 Catalpa Rd
- 1647 Catalpa Rd
- 1675 Catalpa Rd
- 1643 Catalpa Rd
- 1639 Catalpa Rd
- 1686 Catalpa Rd
- 1630 Catalpa Rd