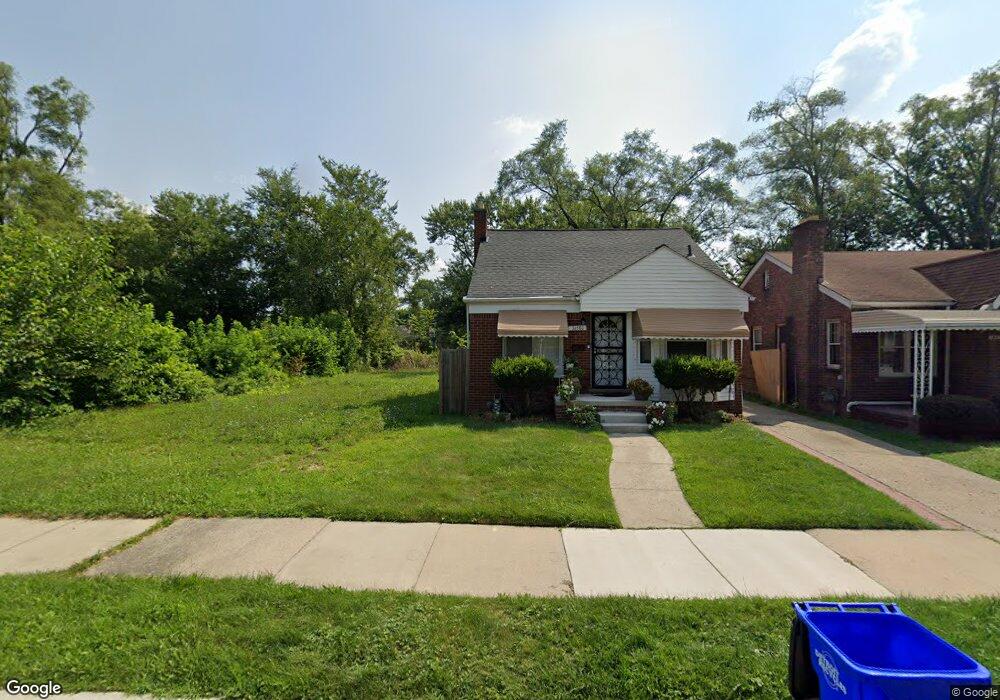
16586 Asbury Park Detroit, MI 48235
Crary-Saint Marys NeighborhoodEstimated Value: $60,000 - $102,000
--
Bed
1
Bath
790
Sq Ft
$107/Sq Ft
Est. Value
About This Home
This home is located at 16586 Asbury Park, Detroit, MI 48235 and is currently estimated at $84,259, approximately $106 per square foot. 16586 Asbury Park is a home located in Wayne County with nearby schools including John R. King Academic And Performing Arts Academy, Charles L. Spain Elementary-Middle School, and Edward 'Duke' Ellington Conservatory of Music and Art.
Ownership History
Date
Name
Owned For
Owner Type
Purchase Details
Closed on
Feb 28, 2022
Sold by
Detroit Land Bank Authority
Bought by
Peake Leroy
Current Estimated Value
Purchase Details
Closed on
Nov 16, 2012
Sold by
Wayne County Treasurer
Bought by
Us Homes4wealth Llc
Purchase Details
Closed on
Mar 29, 2012
Sold by
Home Dreams Capital Llc
Bought by
Living Wheels Inc
Purchase Details
Closed on
Mar 21, 2009
Sold by
Homesolutions Properties Llc
Bought by
Home Dream Capital Llc
Purchase Details
Closed on
Nov 19, 2008
Sold by
Federal National Mortgage Association
Bought by
Homesolutions Properties Llc
Purchase Details
Closed on
Jan 2, 2008
Sold by
Washington Mutual Bank
Bought by
Federal National Mortgage Association
Purchase Details
Closed on
Apr 17, 2003
Sold by
Saunders Carlton D and Saunders Renee
Bought by
Sanders Carnell
Create a Home Valuation Report for This Property
The Home Valuation Report is an in-depth analysis detailing your home's value as well as a comparison with similar homes in the area
Home Values in the Area
Average Home Value in this Area
Purchase History
| Date | Buyer | Sale Price | Title Company |
|---|---|---|---|
| Peake Leroy | -- | None Listed On Document | |
| Us Homes4wealth Llc | $2,213 | None Available | |
| Living Wheels Inc | -- | None Available | |
| Home Dream Capital Llc | -- | None Available | |
| Homesolutions Properties Llc | $1,343 | None Available | |
| Federal National Mortgage Association | -- | None Available | |
| Washington Mutual Bank | $65,043 | None Available | |
| Sanders Carnell | $56,000 | Devon Title Agency |
Source: Public Records
Tax History Compared to Growth
Tax History
| Year | Tax Paid | Tax Assessment Tax Assessment Total Assessment is a certain percentage of the fair market value that is determined by local assessors to be the total taxable value of land and additions on the property. | Land | Improvement |
|---|---|---|---|---|
| 2025 | -- | $1,600 | $0 | $0 |
| 2024 | $30 | $400 | $0 | $0 |
| 2023 | $31 | $0 | $0 | $0 |
| 2022 | -- | $0 | $0 | $0 |
| 2021 | $0 | $0 | $0 | $0 |
| 2020 | $0 | $0 | $0 | $0 |
| 2019 | $2,012 | $0 | $0 | $0 |
| 2018 | $0 | $6,200 | $0 | $0 |
| 2017 | $110 | $5,800 | $0 | $0 |
| 2016 | $1,219 | $12,900 | $0 | $0 |
| 2015 | $1,290 | $12,900 | $0 | $0 |
| 2013 | $1,809 | $18,091 | $0 | $0 |
| 2010 | -- | $25,921 | $767 | $25,154 |
Source: Public Records
Map
Nearby Homes
- 16706 Asbury Park
- 16567 Murray Hill St
- 16598 Biltmore St
- 16735 Saint Marys St
- 16741 Saint Marys St
- 16559 Mansfield St
- 16615 Biltmore St
- 16727 Mansfield St
- 16521 Biltmore St
- 16608 Mansfield St
- 16779 Biltmore St
- 16713 Rutherford St
- 16232 Mansfield St
- 15900 Murray Hill St
- 15872 Asbury Park
- 16560 Oakfield St
- 16111 Gilchrist St
- 16172 Oakfield St
- 16839 Prevost St
- 16845 Prevost St
- 16580 Asbury Park
- 16592 Asbury Park
- 16570 Asbury Park
- 16600 Asbury Park
- 16566 Asbury Park
- 16608 Asbury Park
- 16587 Murray Hill St
- 16581 Murray Hill St
- 16595 Murray Hill St
- 16560 Asbury Park
- 16614 Asbury Park
- 16573 Murray Hill St
- 16601 Murray Hill St
- 16583 Asbury Park
- 16597 Asbury Park
- 16607 Murray Hill St
- 16550 Asbury Park
- 16567 Asbury Park
- 16609 Asbury Park
- 16559 Murray Hill St