B
Seller's Agent in 2025
Beth Wills
Rock House Realty LLC
(614) 371-8400
1 in this area
100 Total Sales
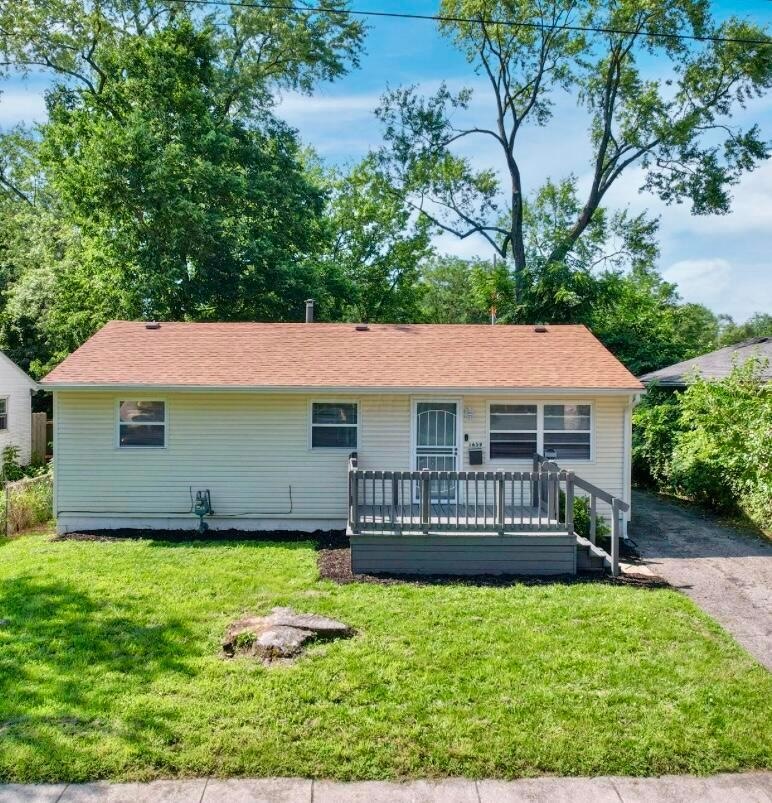


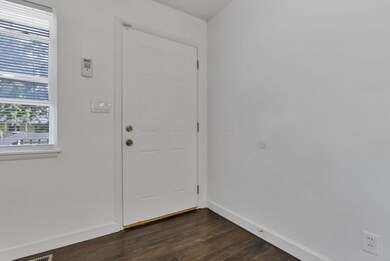
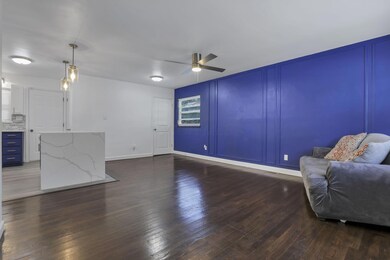

Welcome to this beautifully updated 3-bedroom, 2-bath ranch-style home, offering comfort, style, and functionality. Step inside to find an open-concept main floor filled with natural light and modern finishes throughout. The kitchen, living, and dining areas flow seamlessly, perfect for everyday living or entertaining guests. Downstairs, the fully finished basement offers additional living space, including a flexible room that can serve as a home office, gym, playroom, or media area. Whatever suits your lifestyle. Outside, enjoy a large backyard ideal for relaxing, gardening, or entertaining, plus a storage shed for all your outdoor tools and gear. This move-in-ready home blends modern updates with practical features. Schedule your private showing today!
Last Agent to Sell the Property
Rock House Realty LLC License #2023006860 Listed on: 08/14/2025
| Date | Type | Sale Price | Title Company |
|---|---|---|---|
| Warranty Deed | $217,000 | Landsel Title Agency | |
| Warranty Deed | $95,000 | Axxis Title Agency Ltd | |
| Quit Claim Deed | $7,000 | None Available | |
| Warranty Deed | -- | None Available | |
| Warranty Deed | -- | None Available | |
| Fiduciary Deed | -- | None Available | |
| Deed | -- | -- |
| Date | Status | Loan Amount | Loan Type |
|---|---|---|---|
| Open | $213,069 | FHA | |
| Previous Owner | $92,150 | New Conventional |
| Date | Event | Price | List to Sale | Price per Sq Ft |
|---|---|---|---|---|
| 10/20/2025 10/20/25 | Sold | $217,000 | +3.8% | $154 / Sq Ft |
| 09/04/2025 09/04/25 | Price Changed | $209,000 | -2.7% | $148 / Sq Ft |
| 08/14/2025 08/14/25 | For Sale | $214,900 | -- | $153 / Sq Ft |
| Year | Tax Paid | Tax Assessment Tax Assessment Total Assessment is a certain percentage of the fair market value that is determined by local assessors to be the total taxable value of land and additions on the property. | Land | Improvement |
|---|---|---|---|---|
| 2025 | $2,088 | $46,520 | $4,730 | $41,790 |
| 2024 | $2,088 | $46,520 | $4,730 | $41,790 |
| 2023 | $2,061 | $46,515 | $4,725 | $41,790 |
| 2022 | $1,708 | $32,940 | $3,150 | $29,790 |
| 2021 | $1,711 | $32,940 | $3,150 | $29,790 |
| 2020 | $1,714 | $32,940 | $3,150 | $29,790 |
| 2019 | $1,663 | $27,410 | $2,630 | $24,780 |
| 2018 | $1,094 | $13,060 | $2,630 | $10,430 |
| 2017 | $895 | $13,060 | $2,630 | $10,430 |
| 2016 | $1,499 | $11,940 | $2,630 | $9,310 |
| 2015 | $1,378 | $11,940 | $2,630 | $9,310 |
| 2014 | $740 | $11,940 | $2,630 | $9,310 |
| 2013 | $688 | $13,230 | $2,905 | $10,325 |
B
Seller's Agent in 2025
Beth Wills
Rock House Realty LLC
(614) 371-8400
1 in this area
100 Total Sales

Buyer's Agent in 2025
Radhika Moore
Red 1 Realty
(614) 929-4151
2 in this area
85 Total Sales
Source: Columbus and Central Ohio Regional MLS
MLS Number: 225030735
APN: 010-099003
Disclaimer: Certain information contained herein is derived from information provided by parties other than Homes.com. All information provided is deemed reliable, but is not guaranteed to be accurate and should be independently verified.
![]() IDX information is provided exclusively for personal, non-commercial use, and may not be used for any purpose other than to identify prospective properties consumers may be interested in purchasing.
IDX information is provided exclusively for personal, non-commercial use, and may not be used for any purpose other than to identify prospective properties consumers may be interested in purchasing.
Information is deemed reliable but not guaranteed.
Ask me questions while you tour the home.