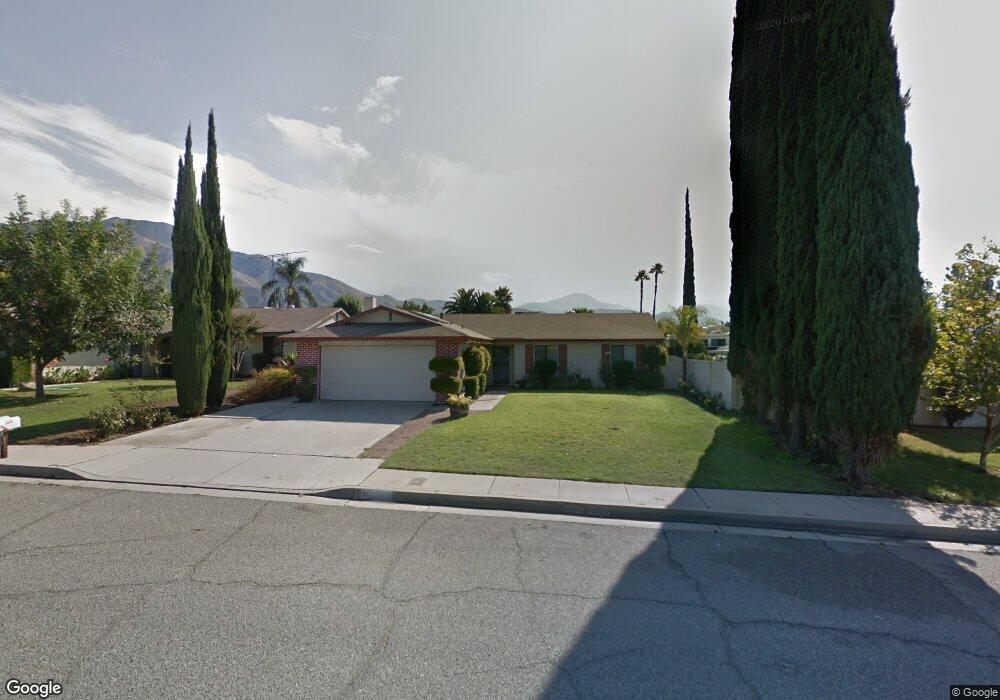
1659 Rhone Ave Highland, CA 92346
Crossroads NeighborhoodEstimated Value: $527,842 - $610,000
4
Beds
2
Baths
1,566
Sq Ft
$363/Sq Ft
Est. Value
About This Home
This home is located at 1659 Rhone Ave, Highland, CA 92346 and is currently estimated at $568,711, approximately $363 per square foot. 1659 Rhone Ave is a home located in San Bernardino County with nearby schools including Thompson Elementary School, Serrano Middle School, and San Gorgonio High School.
Ownership History
Date
Name
Owned For
Owner Type
Purchase Details
Closed on
May 23, 2014
Sold by
Singh Barbara
Bought by
Singh Amit and Singh Sugandha
Current Estimated Value
Home Financials for this Owner
Home Financials are based on the most recent Mortgage that was taken out on this home.
Original Mortgage
$191,000
Outstanding Balance
$127,355
Interest Rate
4.09%
Mortgage Type
New Conventional
Estimated Equity
$441,356
Purchase Details
Closed on
Apr 30, 2010
Sold by
Roberts Anand
Bought by
Singh Barbara and Singh Amit
Purchase Details
Closed on
Apr 9, 2003
Sold by
Castro Jonathan T
Bought by
Roberts Anand and Roberts Rose M
Home Financials for this Owner
Home Financials are based on the most recent Mortgage that was taken out on this home.
Original Mortgage
$177,555
Interest Rate
4.87%
Purchase Details
Closed on
Nov 28, 1994
Sold by
Wilkinson Barry Hugh
Bought by
Castro Jonathan T and Castro De Ann M
Create a Home Valuation Report for This Property
The Home Valuation Report is an in-depth analysis detailing your home's value as well as a comparison with similar homes in the area
Home Values in the Area
Average Home Value in this Area
Purchase History
| Date | Buyer | Sale Price | Title Company |
|---|---|---|---|
| Singh Amit | -- | Fidelity Title | |
| Singh Barbara | -- | None Available | |
| Roberts Anand | $187,000 | Lawyers Title Company | |
| Castro Jonathan T | -- | Continental Lawyers Title Co |
Source: Public Records
Mortgage History
| Date | Status | Borrower | Loan Amount |
|---|---|---|---|
| Open | Singh Amit | $191,000 | |
| Closed | Roberts Anand | $177,555 |
Source: Public Records
Tax History
| Year | Tax Paid | Tax Assessment Tax Assessment Total Assessment is a certain percentage of the fair market value that is determined by local assessors to be the total taxable value of land and additions on the property. | Land | Improvement |
|---|---|---|---|---|
| 2025 | $3,206 | $250,047 | $73,891 | $176,156 |
| 2024 | $3,137 | $245,144 | $72,442 | $172,702 |
| 2023 | $3,057 | $240,338 | $71,022 | $169,316 |
| 2022 | $3,060 | $235,625 | $69,629 | $165,996 |
| 2021 | $3,062 | $231,005 | $68,264 | $162,741 |
| 2020 | $3,069 | $228,636 | $67,564 | $161,072 |
| 2019 | $2,977 | $224,153 | $66,239 | $157,914 |
| 2018 | $2,941 | $219,758 | $64,940 | $154,818 |
| 2017 | $2,849 | $215,449 | $63,667 | $151,782 |
| 2016 | $2,762 | $211,225 | $62,419 | $148,806 |
| 2015 | $2,662 | $208,052 | $61,481 | $146,571 |
| 2014 | $2,257 | $220,819 | $55,204 | $165,615 |
Source: Public Records
Map
Nearby Homes
- 1634 Seine Ave
- 27989 Pacific St
- 1614 Buckeye St
- 7079 Cienega Dr
- 7001 Church Ave Unit 15
- 6986 Church Ave
- 0 La Praix St
- 27540 14th St
- 27631 Villa Ave
- 27611 Villa Ave
- 3734 Pacific St Unit 40
- 28261 Cornus Ct
- 3850 Atlantic Ave Unit 287
- 3850 Atlantic Ave Unit 158
- 3850 Atlantic Ave Unit 151
- 3850 Atlantic Ave Unit 189
- 3850 E Atlantic Unit 284
- 6886 Country Oaks Dr
- 1911 Reedy Ave
- 2035 Reedy Ave
- 1679 Rhone Ave
- 4142 Pasito St
- 1695 Rhone Ave
- 1658 Catalpa Ave
- 4172 Pasito St
- 1658 Rhone Ave
- 1694 Catalpa Ave
- 1676 Rhone Ave
- 1705 Rhone Ave
- 1640 Rhone Ave
- 4135 Pasito St
- 4149 Pasito St
- 1694 Rhone Ave
- 1622 Rhone Ave
- 4165 Pasito St
- 1704 Catalpa Ave
- 1723 Rhone Ave
- 1704 Rhone Ave
- 1604 Rhone Ave
- 4179 Pasito St
Your Personal Tour Guide
Ask me questions while you tour the home.