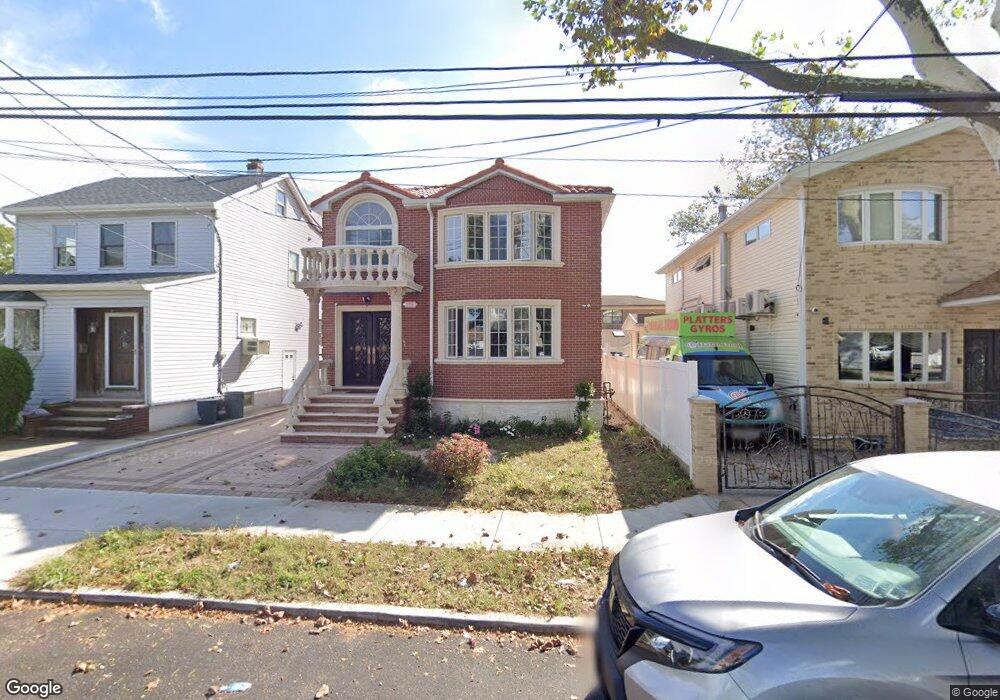
166-06 76th Ave Flushing, NY 11366
Hillcrest NeighborhoodEstimated Value: $1,369,000 - $1,838,314
4
Beds
3
Baths
2,700
Sq Ft
$618/Sq Ft
Est. Value
About This Home
This home is located at 166-06 76th Ave, Flushing, NY 11366 and is currently estimated at $1,669,829, approximately $618 per square foot. 166-06 76th Ave is a home located in Queens County with nearby schools including P.S. 154, I.S. 250 - The Robert F. Kennedy Community Middle School, and Al-Mamoor School.
Ownership History
Date
Name
Owned For
Owner Type
Purchase Details
Closed on
Apr 28, 2017
Sold by
Singer Group Corp
Bought by
Lee Darren F and Lee Miao Xia
Current Estimated Value
Purchase Details
Closed on
Dec 9, 2016
Sold by
Chrissy A Klidonas and Chrissy A Klidonas As Trustee
Bought by
Singer Group Corp
Home Financials for this Owner
Home Financials are based on the most recent Mortgage that was taken out on this home.
Original Mortgage
$575,000
Interest Rate
4.03%
Mortgage Type
New Conventional
Purchase Details
Closed on
Apr 2, 1997
Sold by
Klidonas Christina and Castrovinci Salvatore
Bought by
Klidonas Christina and Testamentary Trust Of Salvatore Castrovi
Purchase Details
Closed on
Jun 9, 1995
Sold by
Castrovinci Felicia
Bought by
Castrovinci Salvatore
Create a Home Valuation Report for This Property
The Home Valuation Report is an in-depth analysis detailing your home's value as well as a comparison with similar homes in the area
Home Values in the Area
Average Home Value in this Area
Purchase History
| Date | Buyer | Sale Price | Title Company |
|---|---|---|---|
| Lee Darren F | $850,500 | -- | |
| Lee Darren F | $850,500 | -- | |
| Lee Darren F | $850,500 | -- | |
| Singer Group Corp | $700,000 | -- | |
| Singer Group Corp | $700,000 | -- | |
| Singer Group Corp | $700,000 | -- | |
| Klidonas Christina | $160,000 | Lawyers Title Insurance Corp | |
| Klidonas Christina | -- | Lawyers Title Insurance Corp | |
| Castrovinci Salvatore | -- | -- | |
| Castrovinci Salvatore | -- | -- |
Source: Public Records
Mortgage History
| Date | Status | Borrower | Loan Amount |
|---|---|---|---|
| Previous Owner | Singer Group Corp | $575,000 |
Source: Public Records
Tax History
| Year | Tax Paid | Tax Assessment Tax Assessment Total Assessment is a certain percentage of the fair market value that is determined by local assessors to be the total taxable value of land and additions on the property. | Land | Improvement |
|---|---|---|---|---|
| 2025 | $13,184 | $65,643 | $21,867 | $43,776 |
| 2024 | $6,592 | $65,643 | $26,207 | $39,436 |
| 2023 | $13,184 | $65,643 | $28,826 | $36,817 |
| 2022 | $10,517 | $52,680 | $23,640 | $29,040 |
| 2021 | $10,471 | $49,755 | $23,640 | $26,115 |
| 2020 | $5,131 | $38,415 | $23,640 | $14,775 |
| 2019 | $7,682 | $57,780 | $17,220 | $40,560 |
| 2018 | $7,256 | $35,594 | $11,491 | $24,103 |
| 2017 | $6,546 | $33,580 | $11,767 | $21,813 |
| 2016 | $6,023 | $33,580 | $11,767 | $21,813 |
| 2015 | $3,601 | $31,680 | $13,712 | $17,968 |
| 2014 | $3,601 | $30,604 | $14,792 | $15,812 |
Source: Public Records
Map
Nearby Homes
- 16602 76th Ave
- 76-04 167th St
- 164-12 76th Ave
- 7533 168th St
- 164-38 77th Ave
- 75-05 168th St
- 73-10 169th St
- 162-15 77th Ave
- 166-07 Union Turnpike
- 162-16 77th Rd
- 162-12 77th Rd
- 71-39 166th St
- 16030 76th Ave
- 77-10 162nd St
- 77-14 162nd St
- 160-20 76th Ave
- 80-15 168th St
- 163-07 72nd Ave Unit 5C
- 163-07 72nd Ave Unit 4D
- 163-07 72nd Ave Unit 5A
- 16606 76th Ave
- 16612 76th Ave
- 7611 166th St
- 76-11 166th St Unit 1Fl
- 76-15 166th St Unit 1 Fl
- 76-15 166th St Unit 1st Floor
- 7615 166th St
- 7608 167th St
- 7604 167th St
- 7612 167th St
- 76-08 167th St
- 76-12 167th St
- 7619 166th St
- 7616 167th St
- 7616 167th St
- 76-16 167th St
- 166-05 76th Ave
- 16458 76th Ave
- 76-21 166th St Unit 2
- 7621 166th St
Your Personal Tour Guide
Ask me questions while you tour the home.