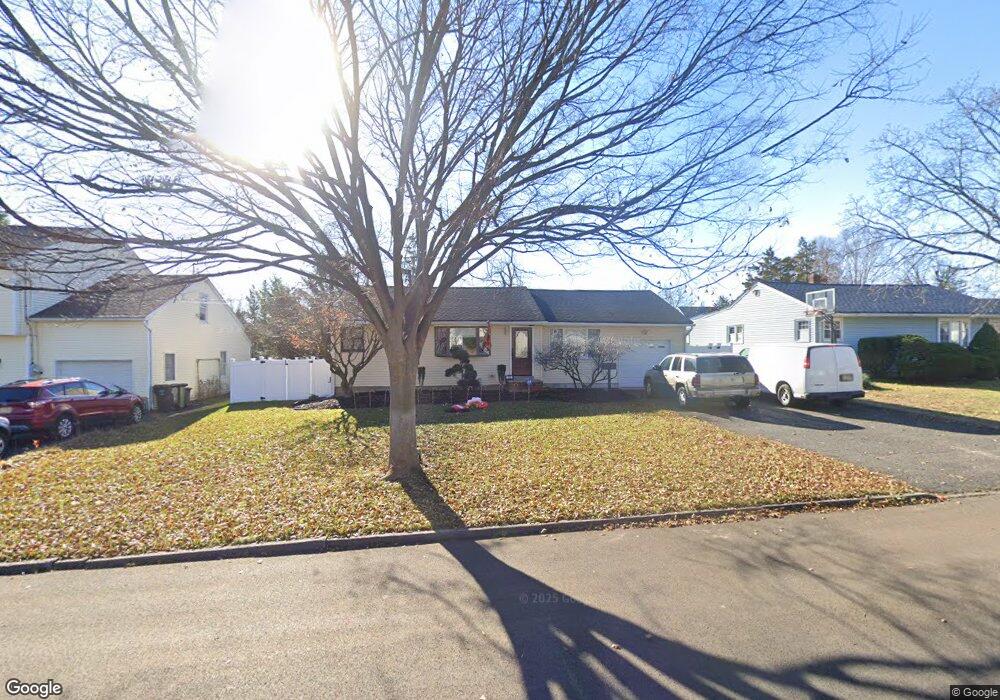
166 Arundel Rd Paramus, NJ 07652
Estimated Value: $743,000 - $924,000
Studio
--
Bath
1,109
Sq Ft
$749/Sq Ft
Est. Value
About This Home
This home is located at 166 Arundel Rd, Paramus, NJ 07652 and is currently estimated at $830,295, approximately $748 per square foot. 166 Arundel Rd is a home located in Bergen County with nearby schools including Paramus High School, Alpine Learning Group, and Paramus Catholic High School.
Ownership History
Date
Name
Owned For
Owner Type
Purchase Details
Closed on
May 6, 2011
Sold by
Nugent Mitchell Benedict and Nugent Kevin
Bought by
Ditommaso Joseph and Ditommaso Melissa
Current Estimated Value
Home Financials for this Owner
Home Financials are based on the most recent Mortgage that was taken out on this home.
Original Mortgage
$300,000
Outstanding Balance
$208,198
Interest Rate
4.85%
Mortgage Type
Purchase Money Mortgage
Estimated Equity
$622,097
Purchase Details
Closed on
Dec 5, 1997
Sold by
Nugent Kevin and Nugent Mary E
Bought by
Nugent Kevin
Create a Home Valuation Report for This Property
The Home Valuation Report is an in-depth analysis detailing your home's value as well as a comparison with similar homes in the area
Home Values in the Area
Average Home Value in this Area
Purchase History
| Date | Buyer | Sale Price | Title Company |
|---|---|---|---|
| Ditommaso Joseph | $375,000 | -- | |
| Nugent Kevin | -- | -- |
Source: Public Records
Mortgage History
| Date | Status | Borrower | Loan Amount |
|---|---|---|---|
| Open | Ditommaso Joseph | $300,000 |
Source: Public Records
Tax History
| Year | Tax Paid | Tax Assessment Tax Assessment Total Assessment is a certain percentage of the fair market value that is determined by local assessors to be the total taxable value of land and additions on the property. | Land | Improvement |
|---|---|---|---|---|
| 2025 | $8,622 | $615,900 | $403,800 | $212,100 |
| 2024 | $8,181 | $569,500 | $368,600 | $200,900 |
| 2023 | $7,743 | $533,300 | $351,000 | $182,300 |
| 2022 | $7,743 | $498,900 | $327,100 | $171,800 |
| 2021 | $7,059 | $426,800 | $296,900 | $129,900 |
| 2020 | $6,705 | $420,400 | $291,900 | $128,500 |
| 2019 | $6,594 | $355,300 | $262,900 | $92,400 |
| 2018 | $6,513 | $355,300 | $262,900 | $92,400 |
| 2017 | $6,399 | $355,300 | $262,900 | $92,400 |
| 2016 | $6,225 | $355,300 | $262,900 | $92,400 |
| 2015 | $6,161 | $355,300 | $262,900 | $92,400 |
| 2014 | $6,108 | $355,300 | $262,900 | $92,400 |
Source: Public Records
Map
Nearby Homes
- 648 Falmouth Ave
- 86 Azalea St
- 704 Evans St
- 82 Azalea St
- 602 Mill Run
- 304 Blauvelt Ct
- 232 W Midland Ave
- 495 Paramus Rd
- 643 Spring Ave
- 18 Vermont Dr
- 218 Mayfair Rd
- 496 Cedar Ln
- 491 Dorchester Rd
- 778 E Ridgewood Ave
- 780 Hilton Place
- 801 Godwin Rd
- 516 Stevens Ave
- 11 Gabriel Ct
- 14 Gabriel Ct
- 19 Gabriel Ct
Your Personal Tour Guide
Ask me questions while you tour the home.