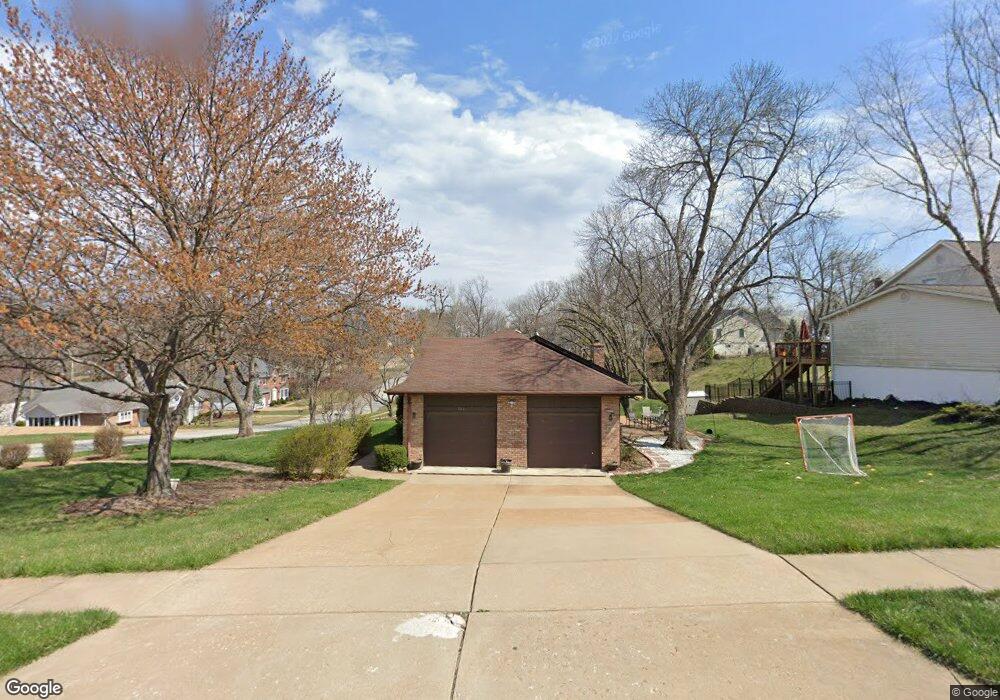
166 Hickory Tree Ct Ballwin, MO 63011
Estimated Value: $430,000 - $452,095
3
Beds
2
Baths
2,228
Sq Ft
$197/Sq Ft
Est. Value
About This Home
This home is located at 166 Hickory Tree Ct, Ballwin, MO 63011 and is currently estimated at $440,024, approximately $197 per square foot. 166 Hickory Tree Ct is a home located in St. Louis County with nearby schools including Westridge Elementary School, Crestview Middle School, and Marquette Sr. High School.
Ownership History
Date
Name
Owned For
Owner Type
Purchase Details
Closed on
Dec 21, 2006
Sold by
Ali Abdullah
Bought by
Larson Josephine Sandy and Thompson Glenn J
Current Estimated Value
Home Financials for this Owner
Home Financials are based on the most recent Mortgage that was taken out on this home.
Original Mortgage
$191,850
Outstanding Balance
$115,084
Interest Rate
6.37%
Mortgage Type
Purchase Money Mortgage
Estimated Equity
$324,940
Purchase Details
Closed on
Jun 13, 2003
Sold by
Warren Gregory C and Warren Cynthia D
Bought by
Ali Abdullah
Home Financials for this Owner
Home Financials are based on the most recent Mortgage that was taken out on this home.
Original Mortgage
$179,000
Interest Rate
5.56%
Mortgage Type
Purchase Money Mortgage
Purchase Details
Closed on
Nov 27, 2000
Sold by
Seibert Charles A
Bought by
Warren Gregory C and Warren Cynthia D
Home Financials for this Owner
Home Financials are based on the most recent Mortgage that was taken out on this home.
Original Mortgage
$213,750
Interest Rate
7.72%
Mortgage Type
Purchase Money Mortgage
Purchase Details
Closed on
Mar 24, 2000
Sold by
Neill Robert E and Neill Mary C
Bought by
Seibert Charles A
Create a Home Valuation Report for This Property
The Home Valuation Report is an in-depth analysis detailing your home's value as well as a comparison with similar homes in the area
Home Values in the Area
Average Home Value in this Area
Purchase History
| Date | Buyer | Sale Price | Title Company |
|---|---|---|---|
| Larson Josephine Sandy | $241,500 | None Available | |
| Ali Abdullah | $259,900 | -- | |
| Warren Gregory C | $237,500 | -- | |
| Warren Gregory C | -- | -- | |
| Seibert Charles A | $75,000 | -- |
Source: Public Records
Mortgage History
| Date | Status | Borrower | Loan Amount |
|---|---|---|---|
| Open | Larson Josephine Sandy | $191,850 | |
| Previous Owner | Ali Abdullah | $179,000 | |
| Previous Owner | Warren Gregory C | $213,750 |
Source: Public Records
Tax History
| Year | Tax Paid | Tax Assessment Tax Assessment Total Assessment is a certain percentage of the fair market value that is determined by local assessors to be the total taxable value of land and additions on the property. | Land | Improvement |
|---|---|---|---|---|
| 2025 | $5,131 | $76,700 | $35,510 | $41,190 |
| 2024 | $5,131 | $73,390 | $23,670 | $49,720 |
| 2023 | $5,127 | $73,390 | $23,670 | $49,720 |
| 2022 | $4,715 | $62,660 | $23,670 | $38,990 |
| 2021 | $4,681 | $62,660 | $23,670 | $38,990 |
| 2020 | $4,730 | $60,380 | $23,220 | $37,160 |
| 2019 | $4,749 | $60,380 | $23,220 | $37,160 |
| 2018 | $5,015 | $60,140 | $19,380 | $40,760 |
| 2016 | $4,305 | $50,820 | $14,590 | $36,230 |
Source: Public Records
Map
Nearby Homes
- 114 Lea Meadows Dr
- 212 Lakeside Dr
- 275 Essen Ct Unit TBB
- 548 Windsor Mill Dr
- 429 Fairview Ct
- 521 Kehrs Mill Rd
- 312 Ballwin Ave
- 203 Morewood Dr
- 313 Saint Lawrence Dr
- 277 Oak Path Dr
- 401 Hillcrest Blvd
- 202 Wildbrier Dr
- 112 Shirley Ln
- 408 Saint Lawrence Dr
- 107 Falmouth Dr
- 103 Denbigh Terrace
- 3 Chappel Ct
- 323 Chipley Cir
- 490 Maymont Dr
- 247 Ramsey Ln
- 162 Hickory Tree Ct
- 212 Cedar Tree Ln
- 215 Cedar Tree Ln
- 165 Hickory Tree Ct
- 211 Cedar Tree Ln
- 158 Hickory Tree Ct
- 169 Hickory Tree Ct
- 211 Spring Oaks Ct
- 208 Cedar Tree Ln
- 161 Hickory Tree Ct
- 207 Spring Oaks Ct
- 173 Hickory Tree Ct
- 207 Cedar Tree Ln
- 154 Hickory Tree Ct
- 157 Hickory Tree Ct
- 178 Hickory Tree Ct
- 163 Spring Oaks Dr
- 177 Hickory Tree Ct
- 210 Hickory Tree Ln
- 109 Caybeth Dr
Your Personal Tour Guide
Ask me questions while you tour the home.