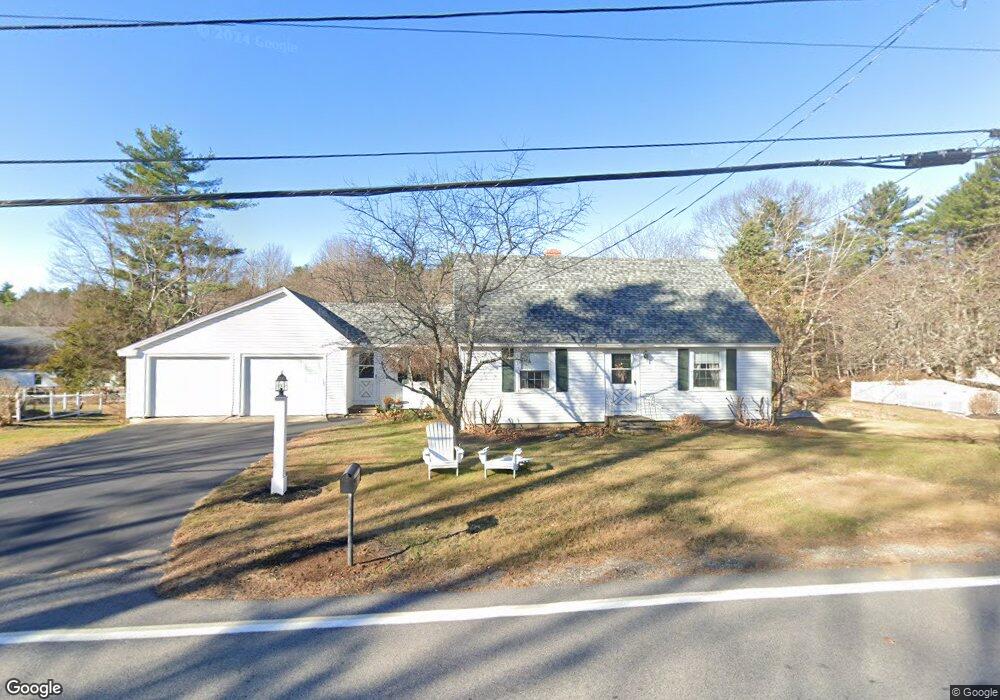
166 Mill Rd North Hampton, NH 03862
Estimated Value: $429,000 - $702,000
3
Beds
3
Baths
1,715
Sq Ft
$338/Sq Ft
Est. Value
About This Home
This home is located at 166 Mill Rd, North Hampton, NH 03862 and is currently estimated at $580,232, approximately $338 per square foot. 166 Mill Rd is a home with nearby schools including North Hampton School, Winnacunnet High School, and Rye Country Day School.
Ownership History
Date
Name
Owned For
Owner Type
Purchase Details
Closed on
Apr 17, 2025
Sold by
White Jr Charles G Est and Cotter
Bought by
White Abigail H and Chase Christopher L
Current Estimated Value
Home Financials for this Owner
Home Financials are based on the most recent Mortgage that was taken out on this home.
Original Mortgage
$287,000
Outstanding Balance
$284,317
Interest Rate
5.88%
Mortgage Type
Purchase Money Mortgage
Estimated Equity
$295,915
Create a Home Valuation Report for This Property
The Home Valuation Report is an in-depth analysis detailing your home's value as well as a comparison with similar homes in the area
Home Values in the Area
Average Home Value in this Area
Purchase History
| Date | Buyer | Sale Price | Title Company |
|---|---|---|---|
| White Abigail H | $384,000 | None Available | |
| White Abigail H | $384,000 | None Available |
Source: Public Records
Mortgage History
| Date | Status | Borrower | Loan Amount |
|---|---|---|---|
| Open | White Abigail H | $287,000 | |
| Closed | White Abigail H | $287,000 |
Source: Public Records
Tax History
| Year | Tax Paid | Tax Assessment Tax Assessment Total Assessment is a certain percentage of the fair market value that is determined by local assessors to be the total taxable value of land and additions on the property. | Land | Improvement |
|---|---|---|---|---|
| 2024 | $7,414 | $579,200 | $300,600 | $278,600 |
| 2023 | $7,211 | $579,200 | $300,600 | $278,600 |
| 2022 | $6,609 | $384,900 | $193,900 | $191,000 |
| 2021 | $6,378 | $384,900 | $193,900 | $191,000 |
| 2020 | $9,407 | $384,900 | $193,900 | $191,000 |
| 2019 | $6,428 | $384,900 | $193,900 | $191,000 |
| 2018 | $6,251 | $384,900 | $193,900 | $191,000 |
| 2017 | $5,839 | $315,600 | $175,000 | $140,600 |
| 2016 | $5,615 | $315,600 | $175,000 | $140,600 |
| 2015 | $5,517 | $315,600 | $175,000 | $140,600 |
| 2014 | $5,381 | $315,600 | $175,000 | $140,600 |
| 2013 | $5,286 | $315,600 | $175,000 | $140,600 |
Source: Public Records
Map
Nearby Homes
Your Personal Tour Guide
Ask me questions while you tour the home.