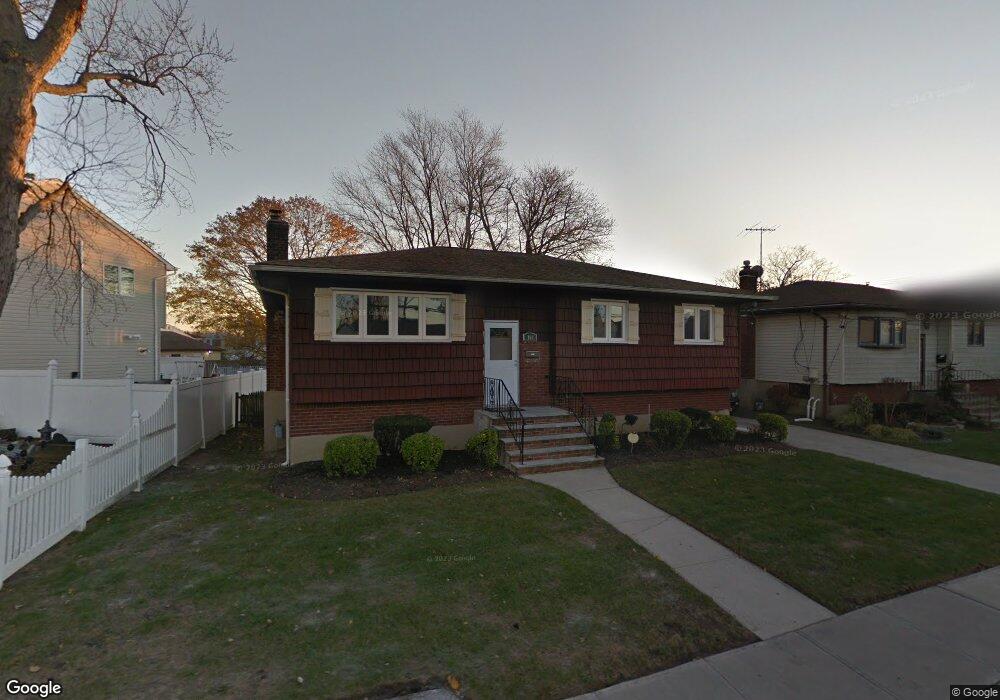
166 Mott St Oceanside, NY 11572
Estimated Value: $822,000 - $836,160
Studio
1
Bath
1,211
Sq Ft
$685/Sq Ft
Est. Value
About This Home
This home is located at 166 Mott St, Oceanside, NY 11572 and is currently estimated at $829,080, approximately $684 per square foot. 166 Mott St is a home located in Nassau County with nearby schools including Boardman Elementary School, Oceanside Middle School, and Oceanside High School.
Ownership History
Date
Name
Owned For
Owner Type
Purchase Details
Closed on
Feb 26, 2021
Sold by
Pryce Michael and Pryce Douglas Janet
Bought by
Pryce Michael and Pryce Janet Douglas
Current Estimated Value
Purchase Details
Closed on
Feb 1, 2010
Sold by
Santoro Assunta
Bought by
Pryce Michael and Douglas-Pryce Janet
Home Financials for this Owner
Home Financials are based on the most recent Mortgage that was taken out on this home.
Original Mortgage
$334,362
Outstanding Balance
$226,432
Interest Rate
5.5%
Mortgage Type
FHA
Estimated Equity
$602,648
Purchase Details
Closed on
Sep 8, 2008
Sold by
Diiori Maria and Santoro Joseph
Bought by
Santoro Assunta
Purchase Details
Closed on
May 17, 2006
Sold by
Santoro Assunta
Create a Home Valuation Report for This Property
The Home Valuation Report is an in-depth analysis detailing your home's value as well as a comparison with similar homes in the area
Home Values in the Area
Average Home Value in this Area
Purchase History
| Date | Buyer | Sale Price | Title Company |
|---|---|---|---|
| Pryce Michael | -- | Langdon Title | |
| Pryce Michael | $360,400 | -- | |
| Santoro Assunta | -- | None Available | |
| -- | -- | -- |
Source: Public Records
Mortgage History
| Date | Status | Borrower | Loan Amount |
|---|---|---|---|
| Open | Pryce Michael | $334,362 |
Source: Public Records
Tax History
| Year | Tax Paid | Tax Assessment Tax Assessment Total Assessment is a certain percentage of the fair market value that is determined by local assessors to be the total taxable value of land and additions on the property. | Land | Improvement |
|---|---|---|---|---|
| 2025 | $13,055 | $535 | $234 | $301 |
| 2024 | $4,062 | $535 | $234 | $301 |
Source: Public Records
Map
Nearby Homes
- 163 Mott St
- 3452 Ocean Ave
- 3461 Ocean Ave
- 24 Strangford Ct
- 3391 Fairway Rd
- 3409 5th St
- 313 Jordan St
- 348 Links Dr E
- 25 Alhambra Dr
- 3363 Lawrence Ave
- 3357 Lawrence Ave
- 29 W Henrietta Ave
- 512 Links Dr E
- 3309 Skillman Ave
- 487 Links Dr E
- 295 Thorn St
- 3154 Roxbury Rd
- 3309 Balsam St
- 3195 Nantucket Ln
- 98 Moore Ave