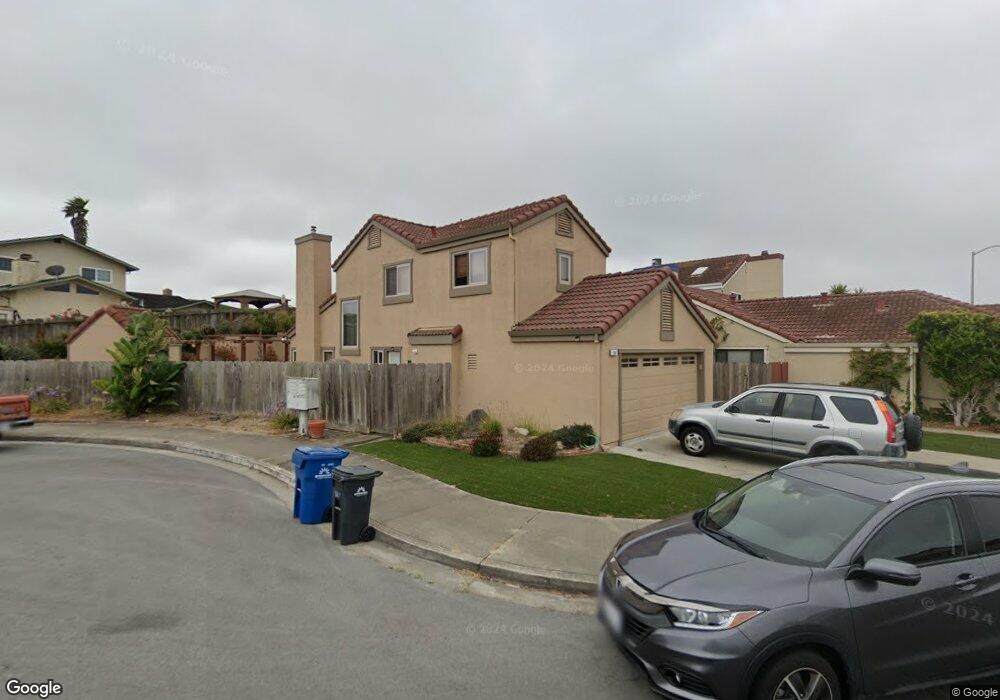
166 Pebble Place Marina, CA 93933
Estimated Value: $876,862 - $924,000
4
Beds
3
Baths
1,500
Sq Ft
$605/Sq Ft
Est. Value
About This Home
This home is located at 166 Pebble Place, Marina, CA 93933 and is currently estimated at $907,466, approximately $604 per square foot. 166 Pebble Place is a home located in Monterey County with nearby schools including Ione Olson Elementary School, Los Arboles Middle School, and Marina High School.
Ownership History
Date
Name
Owned For
Owner Type
Purchase Details
Closed on
Mar 31, 2010
Sold by
Odell Harry E and Odell Janice J
Bought by
Odell Harry Elvin and Odell Janice Jean
Current Estimated Value
Purchase Details
Closed on
Nov 26, 2001
Sold by
Odell Harry E and Odell Janice Jean
Bought by
Odell Harry E and Odell Janice J
Purchase Details
Closed on
Jan 11, 2000
Sold by
Sanders Anthony R and Sanders Ok Son
Bought by
Odell Harry E and Odell Janice Jean
Home Financials for this Owner
Home Financials are based on the most recent Mortgage that was taken out on this home.
Original Mortgage
$150,000
Interest Rate
8.06%
Purchase Details
Closed on
May 1, 1995
Sold by
Osserman Christopher and Osserman Valerie
Bought by
Sanders Anthony R and Sanders Ok Son
Home Financials for this Owner
Home Financials are based on the most recent Mortgage that was taken out on this home.
Original Mortgage
$166,400
Interest Rate
8.46%
Create a Home Valuation Report for This Property
The Home Valuation Report is an in-depth analysis detailing your home's value as well as a comparison with similar homes in the area
Home Values in the Area
Average Home Value in this Area
Purchase History
| Date | Buyer | Sale Price | Title Company |
|---|---|---|---|
| Odell Harry Elvin | -- | None Available | |
| Odell Harry E | -- | Chicago Title | |
| Odell Harry E | $278,000 | Stewart Title | |
| Sanders Anthony R | $212,500 | First American Title Co |
Source: Public Records
Mortgage History
| Date | Status | Borrower | Loan Amount |
|---|---|---|---|
| Previous Owner | Odell Harry E | $150,000 | |
| Previous Owner | Sanders Anthony R | $166,400 |
Source: Public Records
Tax History Compared to Growth
Tax History
| Year | Tax Paid | Tax Assessment Tax Assessment Total Assessment is a certain percentage of the fair market value that is determined by local assessors to be the total taxable value of land and additions on the property. | Land | Improvement |
|---|---|---|---|---|
| 2025 | $4,726 | $427,254 | $192,110 | $235,144 |
| 2024 | $4,726 | $418,878 | $188,344 | $230,534 |
| 2023 | $4,682 | $410,665 | $184,651 | $226,014 |
| 2022 | $4,617 | $402,614 | $181,031 | $221,583 |
| 2021 | $4,547 | $394,721 | $177,482 | $217,239 |
| 2020 | $4,404 | $390,675 | $175,663 | $215,012 |
| 2019 | $4,593 | $383,016 | $172,219 | $210,797 |
| 2018 | $4,430 | $375,507 | $168,843 | $206,664 |
| 2017 | $4,114 | $368,145 | $165,533 | $202,612 |
| 2016 | $4,047 | $360,928 | $162,288 | $198,640 |
| 2015 | $3,987 | $355,508 | $159,851 | $195,657 |
| 2014 | $3,955 | $348,545 | $156,720 | $191,825 |
Source: Public Records
Map
Nearby Homes
- 162 Linde Cir
- 126 Cypress Lakes Ct
- 000 Beach Rd
- 2746 Sand Dunes Ave
- 3248 Fitzgerald Cir
- 246 Cosky Dr
- 221 Mortimers (Unit B) Ln
- 3137 Seacrest Ave Unit 17
- 220 Mortimer Ln
- 3095 Marina Dr Unit 2
- 3095 Marina Dr Unit 30
- 3095 Marina Dr Unit 35
- 189 San Pablo Ct Unit 13
- 310 Carmel Ave
- 356 Reservation Rd Unit 50
- 356 Reservation Rd Unit 68
- 347 Carmel Ave Unit 71
- 347 Carmel Ave Unit 2
- 347 Carmel Ave Unit 15
- 3141 Ocean Terrace
- 164 Pebble Place
- 157 Dolphin Cir
- 172 Lillian Place
- 159 Dolphin Cir
- 174 Lillian Place
- 175 Lillian Place
- 165 Pebble Place
- 163 Pebble Place
- 169 Pebble Place
- 167 Pebble Place
- 161 Dolphin Cir
- 161 Pebble Place
- 155 Dolphin Cir
- 176 Lillian Place
- 163 Dolphin Cir
- 177 Lillian Place
- 154 Dolphin Cir
- 181 Starfish Ct
- 160 Linde Cir
- 164 Linde Cir