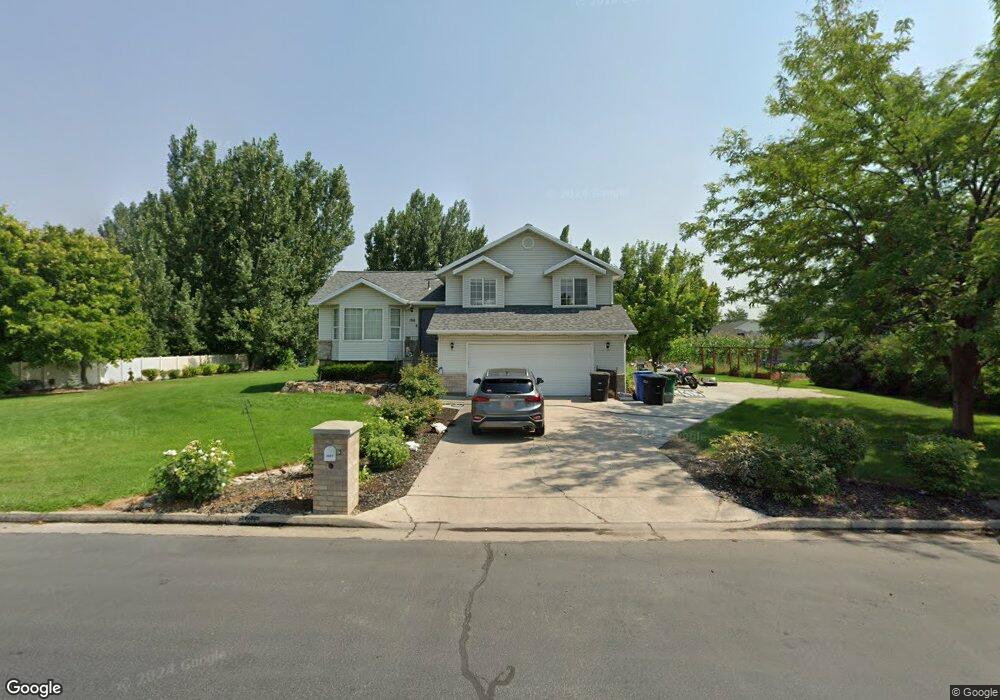
166 W 3650 S Nibley, UT 84321
Estimated Value: $432,000 - $520,527
5
Beds
4
Baths
2,049
Sq Ft
$225/Sq Ft
Est. Value
About This Home
This home is located at 166 W 3650 S, Nibley, UT 84321 and is currently estimated at $461,882, approximately $225 per square foot. 166 W 3650 S is a home located in Cache County with nearby schools including Heritage School, Spring Creek Middle School, and South Cache Middle School.
Ownership History
Date
Name
Owned For
Owner Type
Purchase Details
Closed on
Apr 23, 2020
Sold by
Glad Becky and Seely Becky
Bought by
Glad Becky
Current Estimated Value
Home Financials for this Owner
Home Financials are based on the most recent Mortgage that was taken out on this home.
Original Mortgage
$70,000
Outstanding Balance
$34,624
Interest Rate
3.6%
Mortgage Type
Unknown
Estimated Equity
$427,258
Purchase Details
Closed on
Oct 25, 2007
Sold by
Barrett Rebecca A and Barrett Rebecca
Bought by
Seely Becky
Home Financials for this Owner
Home Financials are based on the most recent Mortgage that was taken out on this home.
Original Mortgage
$203,162
Outstanding Balance
$126,636
Interest Rate
6.27%
Mortgage Type
FHA
Estimated Equity
$335,246
Purchase Details
Closed on
Sep 29, 2006
Sold by
Barrett Jeremy Luane
Bought by
Barrett Rebecca A
Create a Home Valuation Report for This Property
The Home Valuation Report is an in-depth analysis detailing your home's value as well as a comparison with similar homes in the area
Home Values in the Area
Average Home Value in this Area
Purchase History
| Date | Buyer | Sale Price | Title Company |
|---|---|---|---|
| Glad Becky | -- | American Secure Title Logan | |
| Seely Becky | -- | Hickman Land Title Company | |
| Barrett Rebecca A | -- | None Available |
Source: Public Records
Mortgage History
| Date | Status | Borrower | Loan Amount |
|---|---|---|---|
| Open | Glad Becky | $70,000 | |
| Open | Seely Becky | $203,162 |
Source: Public Records
Tax History Compared to Growth
Tax History
| Year | Tax Paid | Tax Assessment Tax Assessment Total Assessment is a certain percentage of the fair market value that is determined by local assessors to be the total taxable value of land and additions on the property. | Land | Improvement |
|---|---|---|---|---|
| 2025 | $154 | $204,640 | $0 | $0 |
| 2024 | $1,646 | $204,845 | $0 | $0 |
| 2023 | $1,726 | $201,160 | $0 | $0 |
| 2022 | $1,797 | $201,155 | $0 | $0 |
| 2021 | $1,781 | $309,595 | $85,000 | $224,595 |
| 2020 | $1,561 | $258,432 | $85,000 | $173,432 |
| 2019 | $1,638 | $258,431 | $85,000 | $173,431 |
| 2018 | $1,353 | $208,410 | $57,600 | $150,810 |
| 2017 | $1,313 | $107,085 | $0 | $0 |
| 2016 | $1,328 | $107,085 | $0 | $0 |
| 2015 | $1,162 | $94,370 | $0 | $0 |
| 2014 | $1,136 | $94,370 | $0 | $0 |
| 2013 | -- | $98,060 | $0 | $0 |
Source: Public Records
Map
Nearby Homes
- 173 W 3175 S
- 189 W 3175 S
- 396 W 3650 S
- 3400 S 250 W Unit 2
- 191 W 3175 S Unit U629
- 191 W 3175 S
- 186 W 3175 S
- 185 W 3175 S
- 182 W 3175 S
- 262 W 3400 S Unit 11
- 324 W 3400 S Unit 7
- 278 W 3400 S Unit 10
- 294 W 3400 S Unit 9
- 308 W 3400 S Unit 8
- 338 W 3400 S Unit 6
- 187 W 3175 S
- 268 W 3400 S Unit 5
- 3883 S 250 E
- 4009 S Cottonwoods Ct
- 3262 S 470 W