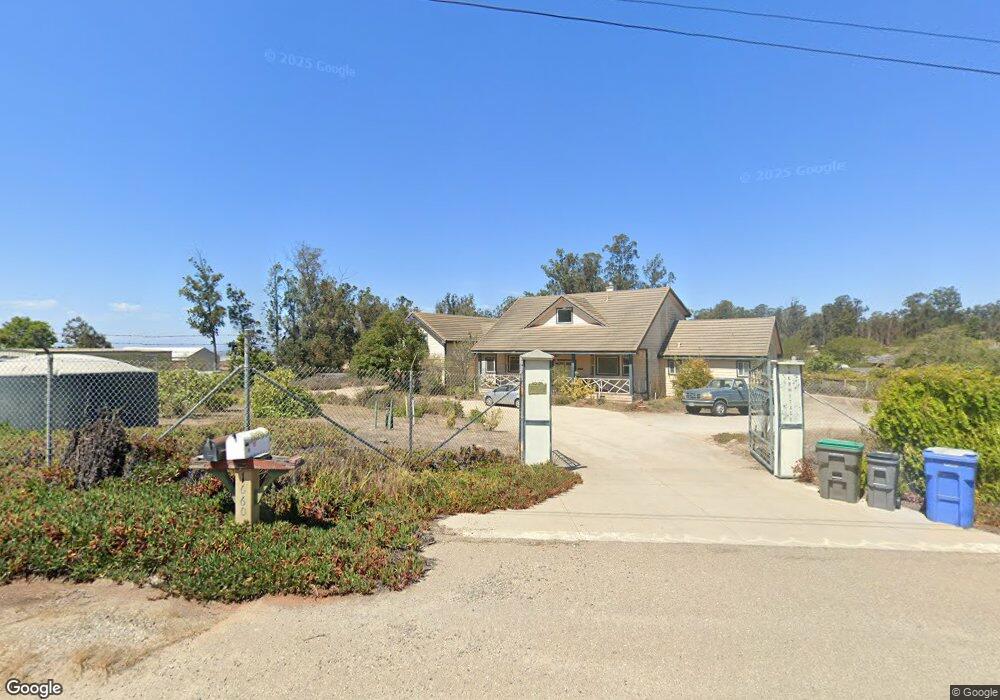
1660 Woodhaven Way Nipomo, CA 93444
Estimated Value: $1,487,000 - $1,948,000
4
Beds
4
Baths
3,703
Sq Ft
$469/Sq Ft
Est. Value
About This Home
This home is located at 1660 Woodhaven Way, Nipomo, CA 93444 and is currently estimated at $1,735,857, approximately $468 per square foot. 1660 Woodhaven Way is a home located in San Luis Obispo County with nearby schools including Dorothea Lange Elementary School, Mesa Middle School, and Nipomo High School.
Ownership History
Date
Name
Owned For
Owner Type
Purchase Details
Closed on
May 29, 2024
Sold by
Cowgill Deborah S
Bought by
Deborah S Cowgill Living Trust and Cowgill
Current Estimated Value
Purchase Details
Closed on
Dec 17, 2009
Sold by
Sepich Filippa Josianne
Bought by
Cowgill Deborah S
Home Financials for this Owner
Home Financials are based on the most recent Mortgage that was taken out on this home.
Original Mortgage
$200,000
Interest Rate
4.91%
Mortgage Type
New Conventional
Purchase Details
Closed on
Feb 1, 2006
Sold by
Sepich Filippa J
Bought by
Sepich Filippa J
Purchase Details
Closed on
May 18, 2005
Sold by
Sepich John Edward
Bought by
Sepich Filippa Josianne
Create a Home Valuation Report for This Property
The Home Valuation Report is an in-depth analysis detailing your home's value as well as a comparison with similar homes in the area
Home Values in the Area
Average Home Value in this Area
Purchase History
| Date | Buyer | Sale Price | Title Company |
|---|---|---|---|
| Deborah S Cowgill Living Trust | -- | None Listed On Document | |
| Cowgill Deborah S | $825,000 | Fidelity National Title Co | |
| Sepich Filippa J | -- | None Available | |
| Sepich Filippa Josianne | -- | Public | |
| Sepich John Edward | -- | Public |
Source: Public Records
Mortgage History
| Date | Status | Borrower | Loan Amount |
|---|---|---|---|
| Previous Owner | Cowgill Deborah S | $200,000 |
Source: Public Records
Tax History Compared to Growth
Tax History
| Year | Tax Paid | Tax Assessment Tax Assessment Total Assessment is a certain percentage of the fair market value that is determined by local assessors to be the total taxable value of land and additions on the property. | Land | Improvement |
|---|---|---|---|---|
| 2025 | $10,880 | $1,064,913 | $322,697 | $742,216 |
| 2024 | $10,754 | $1,044,033 | $316,370 | $727,663 |
| 2023 | $10,754 | $1,023,563 | $310,167 | $713,396 |
| 2022 | $10,590 | $1,003,494 | $304,086 | $699,408 |
| 2021 | $10,569 | $983,819 | $298,124 | $685,695 |
| 2020 | $10,448 | $973,733 | $295,068 | $678,665 |
| 2019 | $10,382 | $954,641 | $289,283 | $665,358 |
| 2018 | $10,257 | $935,923 | $283,611 | $652,312 |
| 2017 | $10,064 | $917,572 | $278,050 | $639,522 |
| 2016 | $9,490 | $899,582 | $272,599 | $626,983 |
| 2015 | $9,353 | $886,071 | $268,505 | $617,566 |
| 2014 | $9,004 | $868,715 | $263,246 | $605,469 |
Source: Public Records
Map
Nearby Homes
- 1350 Ohio Way
- 0 Indiana Way Unit PI25034009
- 1195 Trail View Place
- 981 Trail View Place
- 1441 Via Vista
- 1255 Viva Way
- 1455 Via Vista
- 1175 Danielle Ct
- 1245 Justin Ln
- 1160 Korey Ct
- 1147 Vaquero Way
- 1441 Vicki Ln
- 1084 Emma Ln
- 1685 Scenic View Way
- 161 Lot Scenic View Way
- 0 Scenic View Way
- 1539 Vista Tesoro Place
- 1187 Swallowtail Way
- 1354 Trail View Place
- 1153 Spring Azure Way
- 1657 Woodhaven Way
- 0 Woodhaven Way Unit SL139317
- 0 Woodhaven Way Unit SL139318
- 0 Woodhaven Way Unit PI1053238
- 0 Woodhaven Way Unit SP17179710
- 0 Woodhaven Way Unit Lot 1 139318
- 0 Woodhaven Way Unit Lot 4 139317
- 0 Woodhaven Way Unit 131241
- 0 Woodhaven Way Unit 2917
- 0 Woodhaven Way Unit 990943
- 0 Woodhaven Way Unit 981309
- 0 Woodhaven Way Unit 125959
- 0 Woodhaven Way Unit PI22090246
- 1567 Woodhaven Way
- 1255 Sunnybrook Ln
- 1510 Woodhaven Way
- 1545 Michigan Way
- 1225 Sunnybrook Ln