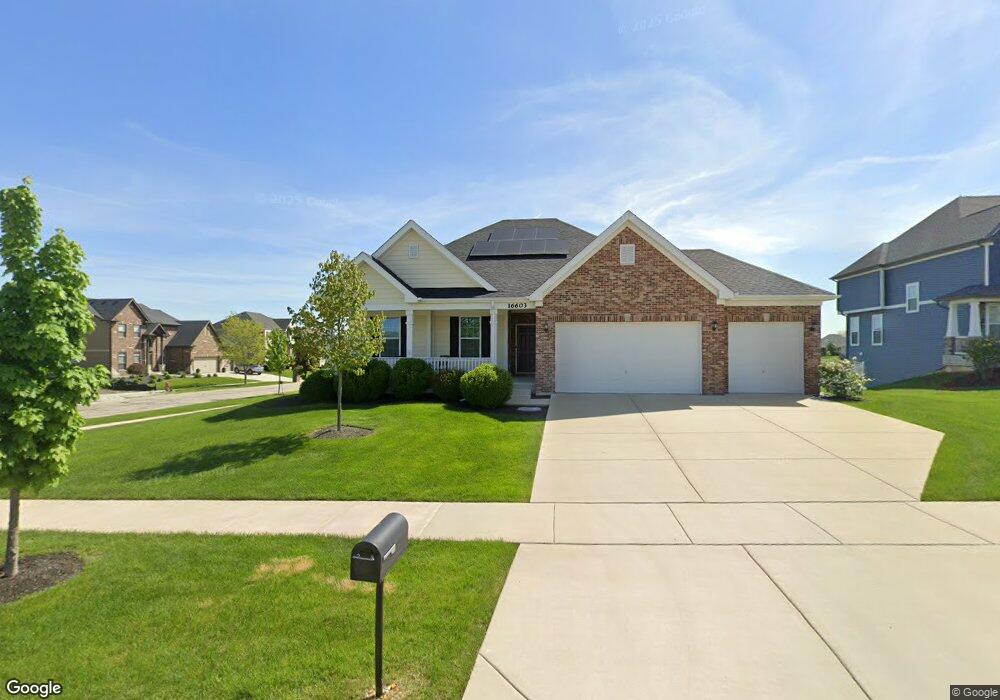
16603 S Rock Ct Plainfield, IL 60586
West Plainfield NeighborhoodEstimated Value: $519,480 - $679,000
Studio
--
Bath
--
Sq Ft
17,860
Sq Ft Lot
About This Home
This home is located at 16603 S Rock Ct, Plainfield, IL 60586 and is currently estimated at $570,370. 16603 S Rock Ct is a home located in Will County with nearby schools including Meadow View Elementary School, Aux Sable Middle School, and Plainfield South High School.
Ownership History
Date
Name
Owned For
Owner Type
Purchase Details
Closed on
Nov 21, 2019
Sold by
Ap Homes Llc
Bought by
Devere James H and Devere Lynne M
Current Estimated Value
Home Financials for this Owner
Home Financials are based on the most recent Mortgage that was taken out on this home.
Original Mortgage
$151,100
Outstanding Balance
$133,968
Interest Rate
4%
Mortgage Type
New Conventional
Estimated Equity
$436,402
Purchase Details
Closed on
Nov 10, 2017
Sold by
Obernoi Sundeep
Bought by
Ap Homes Llc
Home Financials for this Owner
Home Financials are based on the most recent Mortgage that was taken out on this home.
Original Mortgage
$1,222,000
Interest Rate
3.91%
Mortgage Type
Construction
Purchase Details
Closed on
Jun 9, 2010
Sold by
Pnc Bank National Association
Bought by
Oberoi Sundeep
Purchase Details
Closed on
Mar 23, 2009
Sold by
Avian Homes Inc
Bought by
National City Bank
Purchase Details
Closed on
Jan 14, 2009
Sold by
Avian Homes Inc
Bought by
National City Bank
Create a Home Valuation Report for This Property
The Home Valuation Report is an in-depth analysis detailing your home's value as well as a comparison with similar homes in the area
Home Values in the Area
Average Home Value in this Area
Purchase History
| Date | Buyer | Sale Price | Title Company |
|---|---|---|---|
| Devere James H | $381,100 | Stewart Title | |
| Ap Homes Llc | $157,000 | Greater Illinois Title Co | |
| Oberoi Sundeep | $45,000 | Central Illinois Title | |
| National City Bank | $77,400 | None Available | |
| National City Bank | $77,400 | None Available |
Source: Public Records
Mortgage History
| Date | Status | Borrower | Loan Amount |
|---|---|---|---|
| Open | Devere James H | $151,100 | |
| Previous Owner | Ap Homes Llc | $1,222,000 |
Source: Public Records
Tax History
| Year | Tax Paid | Tax Assessment Tax Assessment Total Assessment is a certain percentage of the fair market value that is determined by local assessors to be the total taxable value of land and additions on the property. | Land | Improvement |
|---|---|---|---|---|
| 2024 | $9,980 | $151,378 | $25,907 | $125,471 |
| 2023 | $9,980 | $136,722 | $23,399 | $113,323 |
| 2022 | $10,071 | $135,074 | $17,872 | $117,202 |
| 2021 | $9,487 | $126,238 | $16,703 | $109,535 |
| 2020 | $9,973 | $122,656 | $16,229 | $106,427 |
| 2019 | $374 | $5,081 | $5,081 | $0 |
| 2018 | $414 | $4,774 | $4,774 | $0 |
| 2017 | $402 | $4,537 | $4,537 | $0 |
| 2016 | $394 | $4,327 | $4,327 | $0 |
| 2015 | $375 | $4,053 | $4,053 | $0 |
| 2014 | $375 | $3,910 | $3,910 | $0 |
| 2013 | $375 | $3,910 | $3,910 | $0 |
Source: Public Records
Map
Nearby Homes
- 25424 W Ashton Dr
- 16332 S Forest Edge Dr
- 16954 Lucas Dr
- 3007 Art Schultz Dr
- 25446 W Ryan Ln
- 16143 S Lake View Rd
- 16151 S Lake View Rd
- 16155 S Lake View Rd
- 25504 W Rocky Creek Rd
- 25220 W Zoumar Dr
- 25420 W Springview Dr
- 2813 Joe Adler Dr
- 16515 Driftwood Dr
- 0001 S State Route 59
- 0002 S State Route 59
- 6605 Langsford Ln
- 2801 Crested Butte Trail
- 2710 Telluride Ct
- 15738 Creekview Dr
- 2509 Ruth Fitzgerald Dr
- 25516 W Rock Dr
- 14/15 Rock Ct
- 12/13 Rock Ct
- Lot 14 Rock Ct
- 25515 W Rock Dr
- 25513 W Rock Dr
- 25510 W Rock Dr
- 25517 W Rock Dr
- 16611 S Rock Ct
- 25511 W Rock Dr
- 16606 S Rock Ct
- 16610 S Rock Ct
- 25519 W Rock Dr
- 16615 S Rock Ct
- 16522 S Mueller Cir
- 16526 S Mueller Cir
- 25508 W Rock Dr
- 25521 W Rock Dr
- 16524 S Mueller Cir
- 16520 S Mueller Cir
Your Personal Tour Guide
Ask me questions while you tour the home.