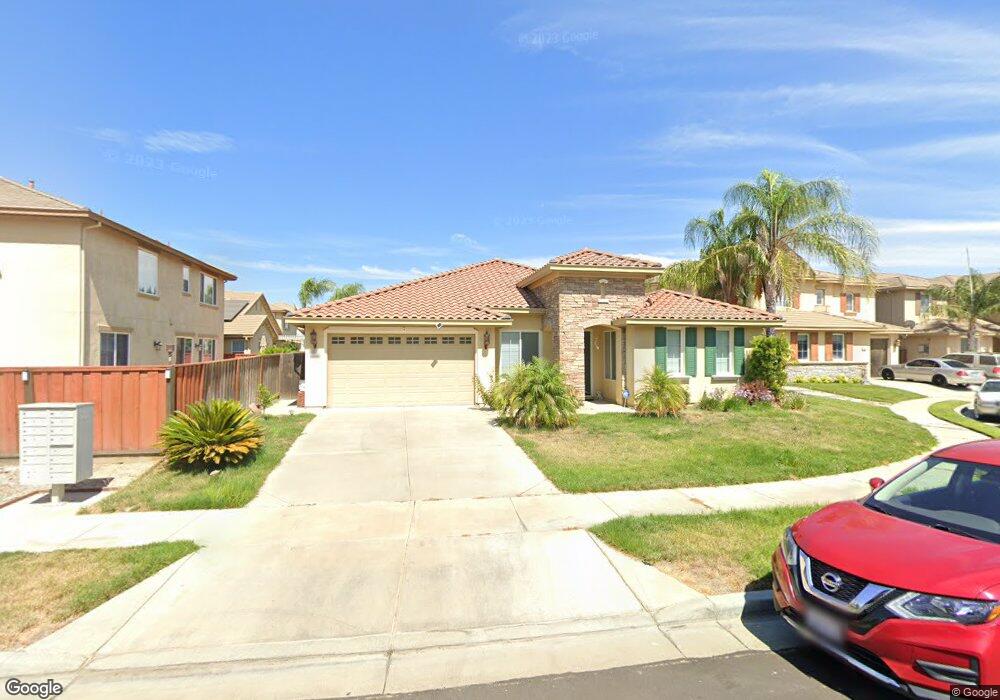
16608 Upper Pasture Ct Lathrop, CA 95330
Estimated Value: $636,955 - $675,000
3
Beds
2
Baths
2,520
Sq Ft
$257/Sq Ft
Est. Value
About This Home
This home is located at 16608 Upper Pasture Ct, Lathrop, CA 95330 and is currently estimated at $648,739, approximately $257 per square foot. 16608 Upper Pasture Ct is a home located in San Joaquin County with nearby schools including Mossdale Elementary School, Lathrop High School, and River Island School of Technology.
Ownership History
Date
Name
Owned For
Owner Type
Purchase Details
Closed on
Sep 22, 2008
Sold by
Lasalle Bank Na
Bought by
Gomez Roger A and Gomez Vilma M
Current Estimated Value
Home Financials for this Owner
Home Financials are based on the most recent Mortgage that was taken out on this home.
Original Mortgage
$231,700
Outstanding Balance
$149,465
Interest Rate
5.9%
Mortgage Type
Purchase Money Mortgage
Estimated Equity
$499,274
Purchase Details
Closed on
Jul 5, 2008
Sold by
Bethune Edgar and Bethune Juanita
Bought by
Lasalle Bank Na and The Mlmi Trust Series 2006-Fmi
Purchase Details
Closed on
Jan 31, 2006
Sold by
Beck Properties Inc
Bought by
Bethune Edgar and Bethune Juanita
Home Financials for this Owner
Home Financials are based on the most recent Mortgage that was taken out on this home.
Original Mortgage
$469,180
Interest Rate
8.35%
Mortgage Type
Balloon
Create a Home Valuation Report for This Property
The Home Valuation Report is an in-depth analysis detailing your home's value as well as a comparison with similar homes in the area
Purchase History
| Date | Buyer | Sale Price | Title Company |
|---|---|---|---|
| Gomez Roger A | $257,545 | North American Title Company | |
| Lasalle Bank Na | $196,990 | None Available | |
| Bethune Edgar | -- | Alliance Title Co |
Source: Public Records
Mortgage History
| Date | Status | Borrower | Loan Amount |
|---|---|---|---|
| Open | Gomez Roger A | $231,700 | |
| Previous Owner | Bethune Edgar | $469,180 |
Source: Public Records
Tax History
| Year | Tax Paid | Tax Assessment Tax Assessment Total Assessment is a certain percentage of the fair market value that is determined by local assessors to be the total taxable value of land and additions on the property. | Land | Improvement |
|---|---|---|---|---|
| 2025 | $7,673 | $338,273 | $99,151 | $239,122 |
| 2024 | $7,455 | $331,641 | $97,207 | $234,434 |
| 2023 | $7,262 | $325,139 | $95,301 | $229,838 |
| 2022 | $7,305 | $318,765 | $93,433 | $225,332 |
| 2021 | $7,178 | $312,515 | $91,601 | $220,914 |
| 2020 | $7,015 | $309,311 | $90,662 | $218,649 |
| 2019 | $6,853 | $297,247 | $88,885 | $208,362 |
| 2018 | $6,769 | $291,420 | $87,143 | $204,277 |
| 2017 | $6,684 | $285,707 | $85,435 | $200,272 |
| 2016 | $6,578 | $280,106 | $83,760 | $196,346 |
| 2014 | $6,737 | $270,499 | $80,887 | $189,612 |
Source: Public Records
Map
Nearby Homes
- 16501 Upper Pasture
- 628 Pioneer Ave
- 523 Danbury Place
- 16206 Sand Bar Way
- 395 Sunol St
- 469 Central Pacific St
- 958 Shearwater Rd
- 15272 Flycatcher Dr
- 16107 Pirates Cove Ln
- 17125 Laurel Oak Ln
- 16095 Pirates Cove Ln
- 16068 Pirates Cove Ln
- 16059 Pirates Cove Ln
- 420 Miramar Dr
- 406 Miramar Dr
- 16035 Pirates Cove Ln
- 392 Miramar Dr
- 378 Miramar Dr
- 15929 Testarossa St
- 277 Danbury Place
- 16636 Upper Pasture Ct
- 792 Red Barn Place
- 780 Red Barn Place
- 16571 Pilgrim Ct
- 766 Red Barn Place
- 16658 Upper Pasture Ct
- 16611 Upper Pasture Ct
- 752 Red Barn Place
- 16625 Upper Pasture Ct
- 16597 Pilgrim Ct
- 16593 Upper Pasture
- 16649 Upper Pasture Ct
- 16581 Upper Pasture
- 16671 Upper Pasture Ct
- 795 Red Barn Place
- 781 Red Barn Place
- 16565 Upper Pasture
- 767 Red Barn Place
- 16592 Pilgrim Ct
- 755 Red Barn Place
Your Personal Tour Guide
Ask me questions while you tour the home.