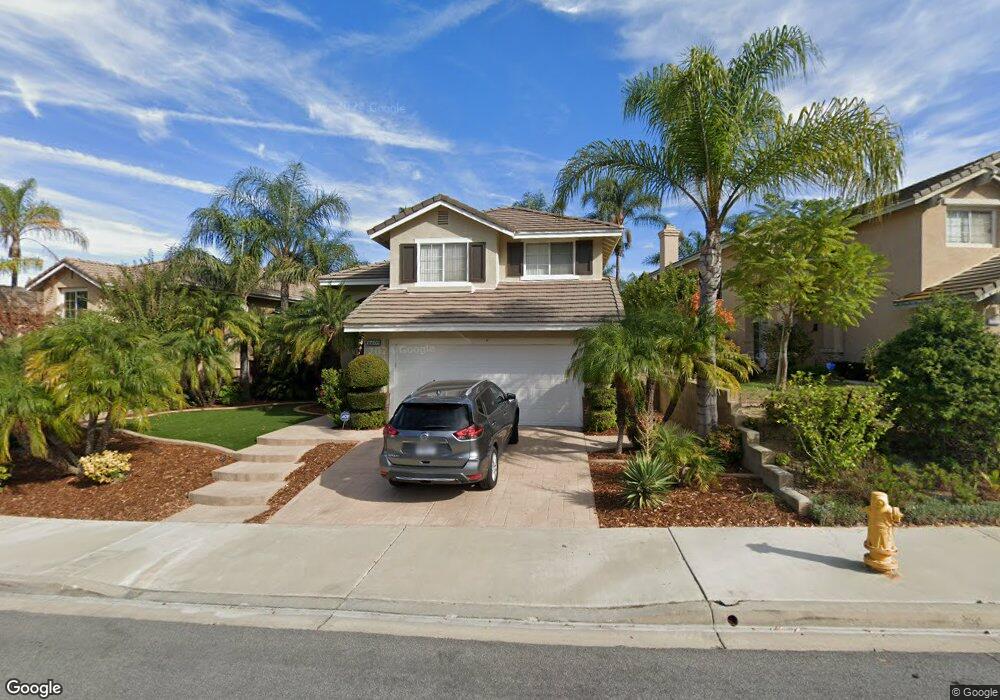
16609 Cobalt Ct Chino Hills, CA 91709
South Chino Hills NeighborhoodEstimated Value: $974,522 - $1,267,000
4
Beds
3
Baths
2,344
Sq Ft
$465/Sq Ft
Est. Value
About This Home
This home is located at 16609 Cobalt Ct, Chino Hills, CA 91709 and is currently estimated at $1,089,381, approximately $464 per square foot. 16609 Cobalt Ct is a home located in San Bernardino County with nearby schools including Michael G. Wickman Elementary School, Robert O. Townsend Junior High School, and Chino Hills High School.
Ownership History
Date
Name
Owned For
Owner Type
Purchase Details
Closed on
Oct 13, 1998
Sold by
Gibbons Karen O
Bought by
Gibbons Karen O
Current Estimated Value
Home Financials for this Owner
Home Financials are based on the most recent Mortgage that was taken out on this home.
Original Mortgage
$152,900
Outstanding Balance
$33,158
Interest Rate
6.79%
Estimated Equity
$1,056,223
Purchase Details
Closed on
Apr 25, 1997
Sold by
Sumitomo Realty & Development Ca Inc
Bought by
Gibbons Karen O
Home Financials for this Owner
Home Financials are based on the most recent Mortgage that was taken out on this home.
Original Mortgage
$152,900
Interest Rate
8.14%
Purchase Details
Closed on
Apr 22, 1997
Sold by
Gibbons Leland H
Bought by
Gibbons Karen O
Home Financials for this Owner
Home Financials are based on the most recent Mortgage that was taken out on this home.
Original Mortgage
$152,900
Interest Rate
8.14%
Create a Home Valuation Report for This Property
The Home Valuation Report is an in-depth analysis detailing your home's value as well as a comparison with similar homes in the area
Home Values in the Area
Average Home Value in this Area
Purchase History
| Date | Buyer | Sale Price | Title Company |
|---|---|---|---|
| Gibbons Karen O | -- | Commonwealth Land Title Co | |
| Gibbons Karen O | $183,500 | Stewart Title | |
| Gibbons Karen O | -- | Stewart Title Insurance Co |
Source: Public Records
Mortgage History
| Date | Status | Borrower | Loan Amount |
|---|---|---|---|
| Open | Gibbons Karen O | $152,900 | |
| Previous Owner | Gibbons Karen O | $152,900 |
Source: Public Records
Tax History Compared to Growth
Tax History
| Year | Tax Paid | Tax Assessment Tax Assessment Total Assessment is a certain percentage of the fair market value that is determined by local assessors to be the total taxable value of land and additions on the property. | Land | Improvement |
|---|---|---|---|---|
| 2025 | $3,785 | $330,498 | $105,865 | $224,633 |
| 2024 | $3,785 | $324,017 | $103,789 | $220,228 |
| 2023 | $3,686 | $317,664 | $101,754 | $215,910 |
| 2022 | $3,665 | $311,435 | $99,759 | $211,676 |
| 2021 | $4,233 | $305,328 | $97,803 | $207,525 |
| 2020 | $4,177 | $302,197 | $96,800 | $205,397 |
| 2019 | $4,106 | $296,272 | $94,902 | $201,370 |
| 2018 | $4,022 | $290,463 | $93,041 | $197,422 |
| 2017 | $3,952 | $284,768 | $91,217 | $193,551 |
| 2016 | $3,736 | $279,184 | $89,428 | $189,756 |
| 2015 | $3,666 | $274,991 | $88,085 | $186,906 |
| 2014 | $3,598 | $269,605 | $86,360 | $183,245 |
Source: Public Records
Map
Nearby Homes
- 16410 Argent Rd
- 4936 Highview St
- 4949 Highview St
- 5176 Glenview St
- 16694 Tourmaline St
- 5185 Highview St
- 16433 Garnet Way
- 16349 Misty Hill Dr
- 16340 Willowmist Ct
- 5142 Cellini Dr
- 16848 Morning Glory Ct
- 4395 Saint Andrews Dr
- 16631 Sagebrush St
- 16629 Quail Country Ave
- 15892 Tanberry Dr
- 15946 Ellington Way
- 15906 Kingston Rd
- 15920 Ellington Way
- 5514 Lisboa St
- 15849 Tanberry Dr
- 16601 Cobalt Ct
- 16617 Cobalt Ct
- 16593 Cobalt Ct
- 16625 Cobalt Ct
- 4910 Mandarin Ct
- 4893 Copper Rd
- 4916 Mandarin Ct
- 16633 Cobalt Ct
- 16585 Cobalt Ct
- 16610 Cobalt Ct
- 16616 Cobalt Ct
- 16604 Cobalt Ct
- 16622 Cobalt Ct
- 4922 Mandarin Ct
- 4901 Copper Rd
- 16598 Cobalt Ct
- 16641 Cobalt Ct
- 16592 Cobalt Ct
- 16628 Cobalt Ct
- 16634 Cobalt Ct