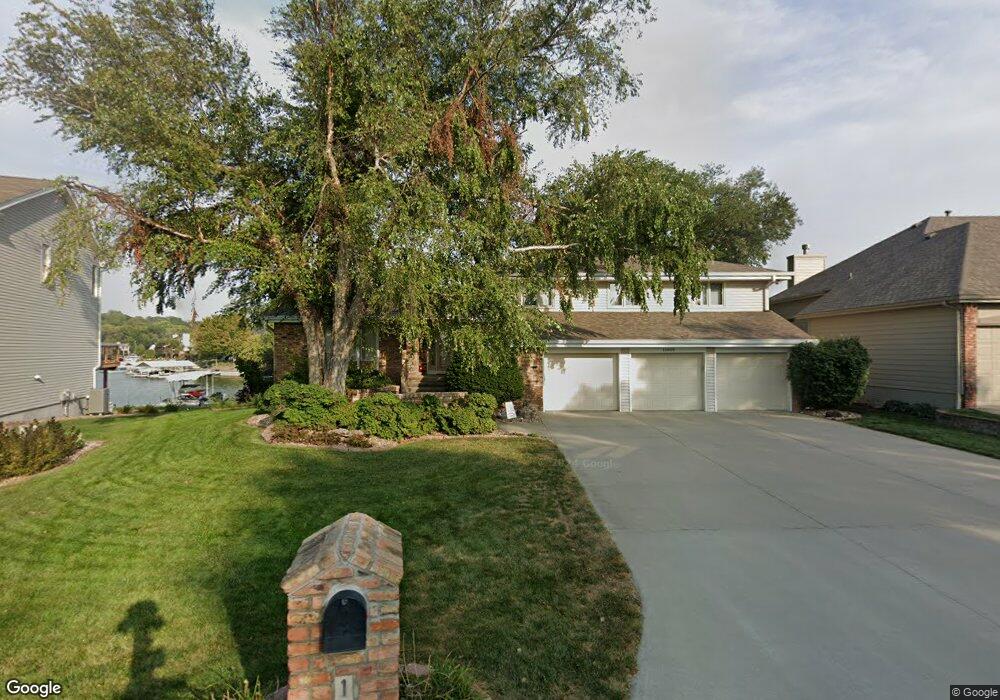
16609 Hilo Cir Papillion, NE 68046
Estimated Value: $592,000 - $638,000
4
Beds
6
Baths
2,991
Sq Ft
$206/Sq Ft
Est. Value
About This Home
This home is located at 16609 Hilo Cir, Papillion, NE 68046 and is currently estimated at $616,384, approximately $206 per square foot. 16609 Hilo Cir is a home located in Sarpy County with nearby schools including Platteview Central Junior High School and Platteview Senior High School.
Ownership History
Date
Name
Owned For
Owner Type
Purchase Details
Closed on
Jun 14, 2021
Sold by
Kinman Adam and Kinman Emy
Bought by
Ostransky Michael and Ostransky Pamela
Current Estimated Value
Purchase Details
Closed on
Apr 12, 2016
Sold by
Gilmore Alan L and Cronin Gilmore Julia M
Bought by
Kinman Emy and Kinman Adam
Home Financials for this Owner
Home Financials are based on the most recent Mortgage that was taken out on this home.
Original Mortgage
$329,650
Interest Rate
3.73%
Mortgage Type
New Conventional
Purchase Details
Closed on
Dec 4, 2015
Sold by
Sommer Frank C and Sommer Patricia E
Bought by
Sommer Frank C and Sommer Patricia E
Purchase Details
Closed on
Aug 11, 2001
Sold by
Ronald Ames G and Ronald Cherie A
Bought by
Sommer Frank C and Sommer Patricia E
Home Financials for this Owner
Home Financials are based on the most recent Mortgage that was taken out on this home.
Original Mortgage
$232,000
Interest Rate
7.07%
Create a Home Valuation Report for This Property
The Home Valuation Report is an in-depth analysis detailing your home's value as well as a comparison with similar homes in the area
Home Values in the Area
Average Home Value in this Area
Purchase History
| Date | Buyer | Sale Price | Title Company |
|---|---|---|---|
| Ostransky Michael | $1,000 | None Listed On Document | |
| Kinman Emy | $347,000 | Titlecore National Llc | |
| Sommer Frank C | -- | None Available | |
| Sommer Frank C | $290,000 | -- |
Source: Public Records
Mortgage History
| Date | Status | Borrower | Loan Amount |
|---|---|---|---|
| Previous Owner | Kinman Emy | $329,650 | |
| Previous Owner | Sommer Frank C | $232,000 |
Source: Public Records
Tax History Compared to Growth
Tax History
| Year | Tax Paid | Tax Assessment Tax Assessment Total Assessment is a certain percentage of the fair market value that is determined by local assessors to be the total taxable value of land and additions on the property. | Land | Improvement |
|---|---|---|---|---|
| 2025 | $7,134 | $527,781 | $175,000 | $352,781 |
| 2024 | $8,943 | $503,267 | $172,000 | $331,267 |
| 2023 | $8,943 | $498,168 | $172,000 | $326,168 |
| 2022 | $8,641 | $453,736 | $120,000 | $333,736 |
| 2021 | $8,316 | $402,598 | $120,000 | $282,598 |
| 2020 | $8,395 | $387,493 | $96,000 | $291,493 |
| 2019 | $8,070 | $372,923 | $96,000 | $276,923 |
| 2018 | $7,900 | $359,269 | $96,000 | $263,269 |
| 2017 | $7,631 | $343,699 | $96,000 | $247,699 |
| 2016 | $7,595 | $337,959 | $96,000 | $241,959 |
| 2015 | $7,613 | $337,974 | $90,000 | $247,974 |
| 2014 | $7,609 | $336,352 | $90,000 | $246,352 |
| 2012 | -- | $330,906 | $90,000 | $240,906 |
Source: Public Records
Map
Nearby Homes
- 7912 Kona Cir
- 8612 Makaha Cir
- 8609 Molokai Dr
- 15560 S 79th Cir
- 19980 White Tail Ln
- 19910 White Tail Ln
- 8700 Raven Dr
- TBD - 15600 S 63rd St
- 6733 Platteview Rd
- 19577 Pheasant Ln
- 6711 Platteview Rd
- 111 acres Platteview Rd
- 7610 S 66th St
- 13002 S 66th Ave
- 12926 S 66th Ave
- 12715 S 79th St
- 12930 S 66th Ave
- 12934 S 66th Ave
- 13003 S 66th Ave
- 12937 S 66th Ave