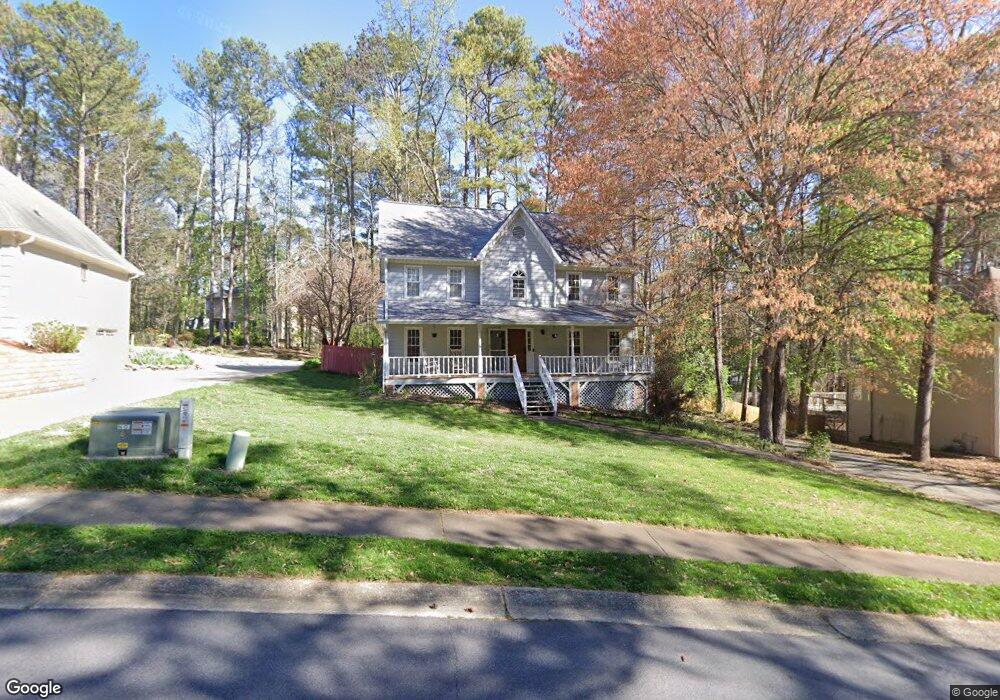
1661 Milford Crk Ovrlk SW Unit 6 Marietta, GA 30008
Southwestern Marietta NeighborhoodEstimated Value: $359,812 - $410,000
3
Beds
4
Baths
1,874
Sq Ft
$210/Sq Ft
Est. Value
About This Home
This home is located at 1661 Milford Crk Ovrlk SW Unit 6, Marietta, GA 30008 and is currently estimated at $394,453, approximately $210 per square foot. 1661 Milford Crk Ovrlk SW Unit 6 is a home located in Cobb County with nearby schools including Birney Elementary School, Smitha Middle School, and Osborne High School.
Ownership History
Date
Name
Owned For
Owner Type
Purchase Details
Closed on
Mar 25, 2014
Sold by
Eller Katherine Ellen
Bought by
Eller Katherine Ellen and Roy Richard G
Current Estimated Value
Purchase Details
Closed on
Nov 30, 2005
Sold by
Mcewen Charles L and Mcewen Barbara A
Bought by
Luceus Pierre G and Luceus Marie G
Purchase Details
Closed on
Jan 22, 2002
Sold by
Eller Katherine E
Bought by
Eller Katherine E
Purchase Details
Closed on
Jun 27, 2000
Sold by
Thompson Laura D and Thompson Gregory T
Bought by
Daniels Katherine E
Home Financials for this Owner
Home Financials are based on the most recent Mortgage that was taken out on this home.
Original Mortgage
$153,900
Interest Rate
8.63%
Mortgage Type
New Conventional
Create a Home Valuation Report for This Property
The Home Valuation Report is an in-depth analysis detailing your home's value as well as a comparison with similar homes in the area
Home Values in the Area
Average Home Value in this Area
Purchase History
| Date | Buyer | Sale Price | Title Company |
|---|---|---|---|
| Eller Katherine Ellen | -- | -- | |
| Luceus Pierre G | $221,000 | -- | |
| Eller Katherine E | -- | -- | |
| Daniels Katherine E | $162,000 | -- |
Source: Public Records
Mortgage History
| Date | Status | Borrower | Loan Amount |
|---|---|---|---|
| Previous Owner | Daniels Katherine E | $153,900 |
Source: Public Records
Tax History Compared to Growth
Tax History
| Year | Tax Paid | Tax Assessment Tax Assessment Total Assessment is a certain percentage of the fair market value that is determined by local assessors to be the total taxable value of land and additions on the property. | Land | Improvement |
|---|---|---|---|---|
| 2025 | $3,473 | $140,356 | $35,200 | $105,156 |
| 2024 | $3,476 | $140,356 | $35,200 | $105,156 |
| 2023 | $2,883 | $138,072 | $10,000 | $128,072 |
| 2022 | $3,018 | $118,240 | $10,000 | $108,240 |
| 2021 | $2,617 | $99,948 | $10,000 | $89,948 |
| 2020 | $2,402 | $90,120 | $10,000 | $80,120 |
| 2019 | $2,248 | $83,088 | $10,000 | $73,088 |
| 2018 | $1,946 | $83,088 | $10,000 | $73,088 |
| 2017 | $1,467 | $63,804 | $10,000 | $53,804 |
| 2016 | $1,469 | $63,804 | $10,000 | $53,804 |
| 2015 | $1,462 | $62,000 | $8,000 | $54,000 |
| 2014 | $1,473 | $62,000 | $0 | $0 |
Source: Public Records
Map
Nearby Homes
- 3123 Milford Chase SW
- 3075 Milford Chase SW
- 3055 Milford Chase Overlook SW
- 1427 Lost Bridge Rd
- 1719 Silverchase Dr SW
- 1559 Woodmore Dr SW
- 1618 Sparrow Wood Ln SW
- 1308 Willamette Way
- 2700 Flintlock Ln SW
- 1613 Sparrow Wood Ln SW Unit 3
- 2964 Edgemont Ln SW
- 3340 Vineland Dr SW
- 1345 Windage Ct SW Unit 6
- 1697 Rustic Dr SW
- 3145 Fern Valley Dr SW
- 1086 Mornington Way
- 0 Burfordi Dr SW Unit 7658493
- 0 Burfordi Dr SW Unit 10637361
- 3004 Michael Dr SW
- 1661 N Milford Creek Ln SW
- 1671 N Milford Creek Ln SW Unit 6
- 1661 Milford Creek Overlook SW
- 1650 Milford Creek Overlook SW
- 1650 Milford Creek Overlook SW Unit 4
- 1641 Milford Creek Overlook SW
- 1681 N Milford Creek Ln SW Unit 6
- 1660 Milford Creek Overlook SW
- 1660 Milford Creek Overlook SW Unit IV
- 1707 Milford Creek Ct SW Unit 4
- 1640 Milford Creek Overlook SW
- 1671 Milford Creek Overlook SW
- 1702 Milford Creek Courts SW
- 1631 Milford Creek Overlook SW
- 1670 Milford Creek Overlook SW
- 1630 Milford Creek Overlook SW
- 1691 Milford Creek Overlook SW
- 1691 N Milford Creek Ln SW Unit 6
- 1681 Milford Creek Overlook SW
- 1680 N Milford Creek Ln SW