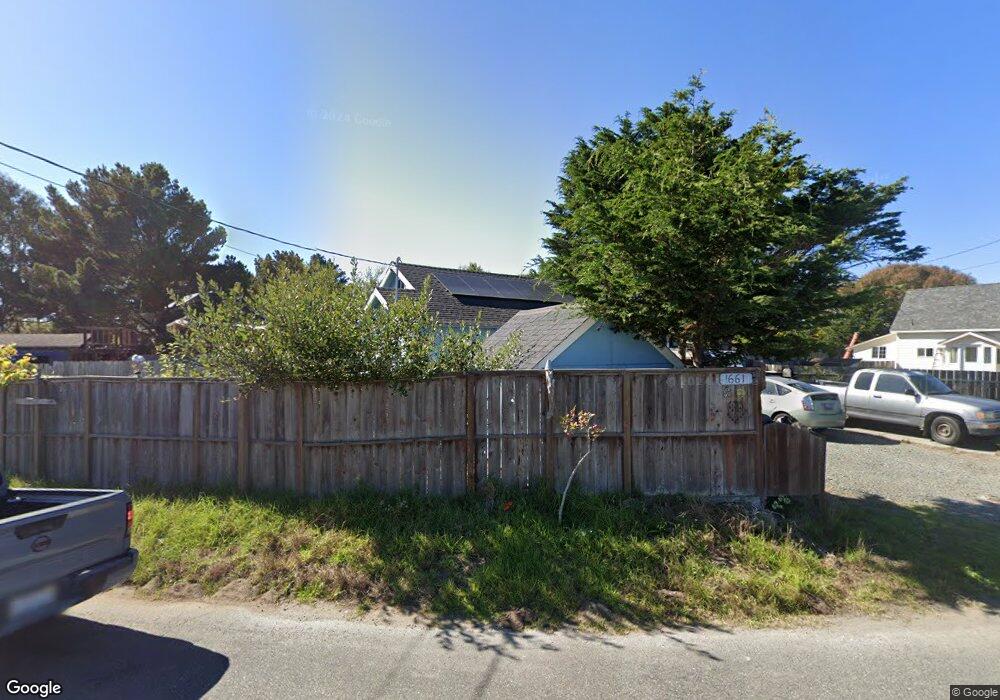
1661 Peninsula Dr Arcata, CA 95521
Manila NeighborhoodEstimated Value: $184,000 - $354,000
Studio
--
Bath
--
Sq Ft
7,797
Sq Ft
About This Home
This home is located at 1661 Peninsula Dr, Arcata, CA 95521 and is currently estimated at $292,714. 1661 Peninsula Dr is a home located in Humboldt County with nearby schools including Arcata Elementary School, Sunny Brae Middle School, and Arcata High School.
Ownership History
Date
Name
Owned For
Owner Type
Purchase Details
Closed on
Jun 20, 2017
Sold by
Faulk Winter
Bought by
Faulk Sequoyah
Current Estimated Value
Purchase Details
Closed on
Aug 12, 2015
Sold by
Faulk Daniel A
Bought by
Faulk Daniel A and Daniel Alan Faulk Revocable Li
Purchase Details
Closed on
Mar 23, 2005
Sold by
Mcsherri Maureen and Faulk Daniel A
Bought by
Faulk Daniel A and Faulk Winter M
Home Financials for this Owner
Home Financials are based on the most recent Mortgage that was taken out on this home.
Original Mortgage
$73,000
Interest Rate
5.53%
Mortgage Type
Purchase Money Mortgage
Purchase Details
Closed on
Feb 17, 2005
Sold by
Haschak Arthur A
Bought by
Mcsherri Maureen and Kellogg Maureen
Home Financials for this Owner
Home Financials are based on the most recent Mortgage that was taken out on this home.
Original Mortgage
$73,000
Interest Rate
5.53%
Mortgage Type
Purchase Money Mortgage
Create a Home Valuation Report for This Property
The Home Valuation Report is an in-depth analysis detailing your home's value as well as a comparison with similar homes in the area
Home Values in the Area
Average Home Value in this Area
Purchase History
| Date | Buyer | Sale Price | Title Company |
|---|---|---|---|
| Faulk Sequoyah | -- | None Available | |
| Faulk Daniel A | -- | None Available | |
| Faulk Daniel A | $73,500 | Fidelity National Title Co | |
| Mcsherri Maureen | -- | -- |
Source: Public Records
Mortgage History
| Date | Status | Borrower | Loan Amount |
|---|---|---|---|
| Previous Owner | Faulk Daniel A | $73,000 |
Source: Public Records
Tax History
| Year | Tax Paid | Tax Assessment Tax Assessment Total Assessment is a certain percentage of the fair market value that is determined by local assessors to be the total taxable value of land and additions on the property. | Land | Improvement |
|---|---|---|---|---|
| 2025 | $1,695 | $116,125 | $38,884 | $77,241 |
| 2024 | $1,695 | $113,849 | $38,122 | $75,727 |
| 2023 | $1,667 | $111,618 | $37,375 | $74,243 |
| 2022 | $1,689 | $109,431 | $36,643 | $72,788 |
| 2021 | $1,629 | $107,286 | $35,925 | $71,361 |
| 2020 | $1,387 | $106,187 | $35,557 | $70,630 |
| 2019 | $1,348 | $104,106 | $34,860 | $69,246 |
| 2018 | $1,321 | $102,066 | $34,177 | $67,889 |
| 2017 | $964 | $70,082 | $18,134 | $51,948 |
| 2016 | $954 | $68,709 | $17,779 | $50,930 |
| 2015 | $946 | $67,677 | $17,512 | $50,165 |
| 2014 | $972 | $66,352 | $17,169 | $49,183 |
Source: Public Records
Map
Nearby Homes
Your Personal Tour Guide
Ask me questions while you tour the home.