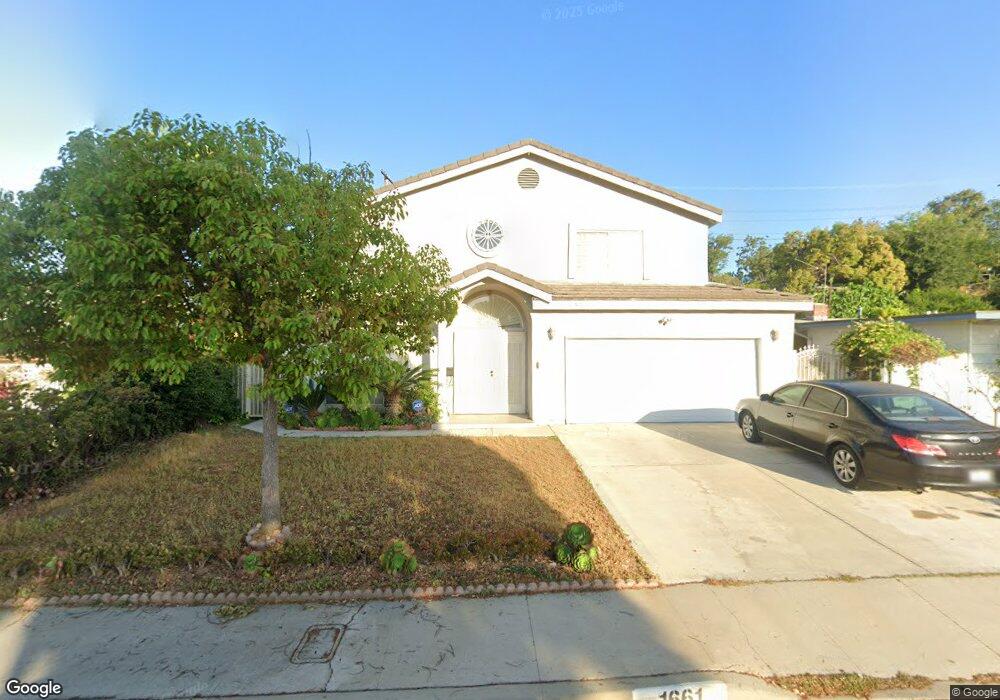
1661 S Ynez Ave Monterey Park, CA 91754
Estimated Value: $1,215,000 - $1,624,000
4
Beds
4
Baths
2,614
Sq Ft
$530/Sq Ft
Est. Value
About This Home
This home is located at 1661 S Ynez Ave, Monterey Park, CA 91754 and is currently estimated at $1,385,999, approximately $530 per square foot. 1661 S Ynez Ave is a home located in Los Angeles County with nearby schools including Bella Vista Elementary School, Macy Intermediate School, and Schurr High School.
Ownership History
Date
Name
Owned For
Owner Type
Purchase Details
Closed on
Apr 7, 2017
Sold by
Yik Fang Yik
Bought by
Yik Fang Yik and Chao Finn
Current Estimated Value
Purchase Details
Closed on
Jun 12, 2000
Sold by
Ching Danny Y
Bought by
Yik Fang Yik and Chao Finn
Home Financials for this Owner
Home Financials are based on the most recent Mortgage that was taken out on this home.
Original Mortgage
$130,000
Interest Rate
8.55%
Purchase Details
Closed on
Jun 24, 1996
Sold by
Chang Shu Chan
Bought by
Ching Danny Year and Yik Christine Phu
Home Financials for this Owner
Home Financials are based on the most recent Mortgage that was taken out on this home.
Original Mortgage
$200,000
Interest Rate
8.09%
Purchase Details
Closed on
Jul 15, 1993
Sold by
Chang Wendy H
Bought by
Chang Lung H and Chang Lung Hsiung
Create a Home Valuation Report for This Property
The Home Valuation Report is an in-depth analysis detailing your home's value as well as a comparison with similar homes in the area
Home Values in the Area
Average Home Value in this Area
Purchase History
| Date | Buyer | Sale Price | Title Company |
|---|---|---|---|
| Yik Fang Yik | -- | None Available | |
| Yik Fang Yik | $260,000 | Investors Title Company | |
| Ching Danny Year | $320,000 | Landsafe Title | |
| Chang Lung H | -- | Provident Title |
Source: Public Records
Mortgage History
| Date | Status | Borrower | Loan Amount |
|---|---|---|---|
| Closed | Yik Fang Yik | $130,000 | |
| Closed | Ching Danny Year | $200,000 |
Source: Public Records
Tax History Compared to Growth
Tax History
| Year | Tax Paid | Tax Assessment Tax Assessment Total Assessment is a certain percentage of the fair market value that is determined by local assessors to be the total taxable value of land and additions on the property. | Land | Improvement |
|---|---|---|---|---|
| 2025 | $7,346 | $549,979 | $248,619 | $301,360 |
| 2024 | $7,346 | $539,196 | $243,745 | $295,451 |
| 2023 | $7,364 | $528,624 | $238,966 | $289,658 |
| 2022 | $7,165 | $518,260 | $234,281 | $283,979 |
| 2021 | $6,867 | $508,099 | $229,688 | $278,411 |
| 2019 | $6,603 | $493,030 | $222,876 | $270,154 |
| 2018 | $6,723 | $483,363 | $218,506 | $264,857 |
| 2016 | $6,412 | $464,595 | $210,022 | $254,573 |
| 2015 | $6,019 | $457,618 | $206,868 | $250,750 |
| 2014 | $5,936 | $448,655 | $202,816 | $245,839 |
Source: Public Records
Map
Nearby Homes
- 1351 S Ynez Ave
- 1301 S Atlantic Blvd Unit 234C
- 1240 S Ynez Ave
- 1027 De la Fuente St
- 1701 S Mcpherrin Ave
- 501 W Floral Dr
- 1800 Fernbank Ave
- 824 De la Fuente St
- 1100 S Grandridge Ave
- 413 W Riggin St
- 498 W Riggin St
- 500 A S Garfield Unit A
- 1581 College View Dr
- 532 W Gleason St
- 2012 S Garfield Ave
- 1545 Star Ridge Dr
- 0 S Prospect Dr Unit CV23115343
- 1804 Wilcox Ave
- 105 E Floral Dr
- 125 E Arlight St
- 1651 S Ynez Ave
- 1671 S Ynez Ave
- 1660 S Atlantic Blvd
- 1631 S Ynez Ave
- 1650 S Atlantic Blvd
- 1670 S Atlantic Blvd
- 1681 S Ynez Ave
- 1660 S Ynez Ave
- 1630 S Atlantic Blvd
- 1680 S Ynez Ave
- 1650 S Ynez Ave
- 1601 S Ynez Ave
- 1680 S Atlantic Blvd
- 1700 S Ynez Ave
- 1630 S Ynez Ave
- 1701 S Ynez Ave
- 1600 S Atlantic Blvd
- 1581 S Ynez Ave
- 1700 S Atlantic Blvd Unit 1
- 1700 S Atlantic Blvd