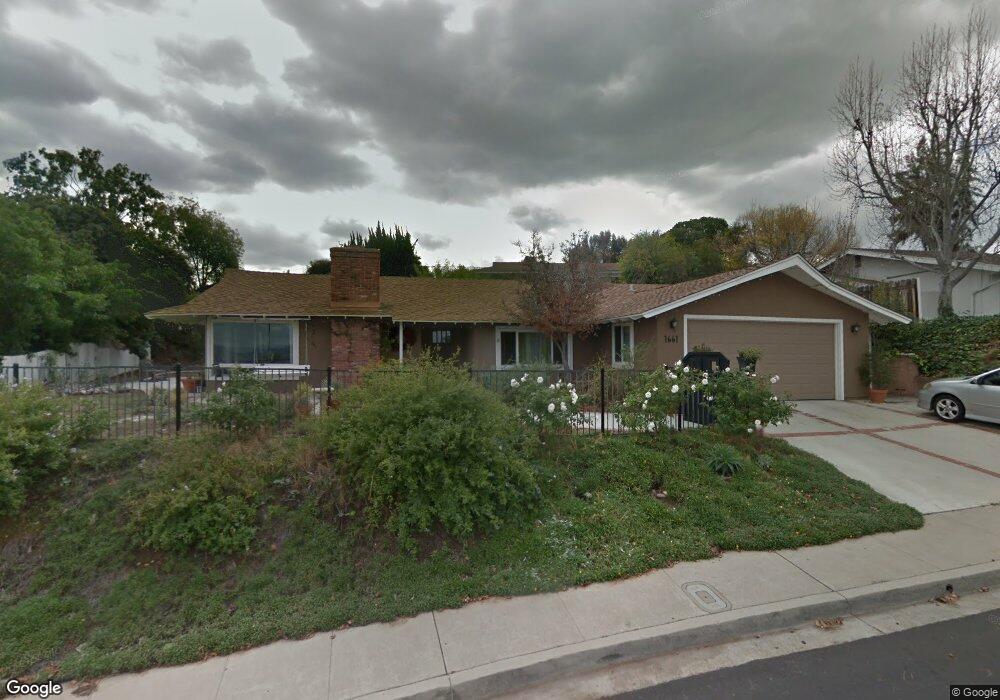
1661 View Way El Cajon, CA 92020
Fletcher Hills NeighborhoodEstimated Value: $925,229 - $1,188,000
3
Beds
2
Baths
1,956
Sq Ft
$522/Sq Ft
Est. Value
About This Home
This home is located at 1661 View Way, El Cajon, CA 92020 and is currently estimated at $1,020,057, approximately $521 per square foot. 1661 View Way is a home located in San Diego County with nearby schools including Northmont Elementary School, Parkway Academy, and Grossmont High School.
Ownership History
Date
Name
Owned For
Owner Type
Purchase Details
Closed on
Sep 23, 2020
Sold by
Maxwell Erica Lynn and Maxwell Daniel Erica
Bought by
Maxwell Erica Lynn and Erica Maxwell Trust
Current Estimated Value
Purchase Details
Closed on
May 3, 2011
Sold by
Daniel Robert A and Daniel Erica M
Bought by
Daniel Erica M and Daniel Erica Maxwell
Home Financials for this Owner
Home Financials are based on the most recent Mortgage that was taken out on this home.
Original Mortgage
$181,000
Outstanding Balance
$124,328
Interest Rate
4.63%
Mortgage Type
New Conventional
Estimated Equity
$895,729
Purchase Details
Closed on
Jan 30, 2001
Sold by
Daniel Robert A and Daniel Erica M
Bought by
Daniel Robert A and Daniel Erica M
Purchase Details
Closed on
Jun 12, 1998
Sold by
Lewis Trust 10-21-92 and Lewis Irene
Bought by
Daniel Robert A and Daniel Erica M
Home Financials for this Owner
Home Financials are based on the most recent Mortgage that was taken out on this home.
Original Mortgage
$194,800
Interest Rate
7.06%
Create a Home Valuation Report for This Property
The Home Valuation Report is an in-depth analysis detailing your home's value as well as a comparison with similar homes in the area
Home Values in the Area
Average Home Value in this Area
Purchase History
| Date | Buyer | Sale Price | Title Company |
|---|---|---|---|
| Maxwell Erica Lynn | -- | None Available | |
| Daniel Erica M | -- | North American Title Co Inc | |
| Daniel Robert A | -- | -- | |
| Daniel Robert A | $243,000 | Commonwealth Land Title Co |
Source: Public Records
Mortgage History
| Date | Status | Borrower | Loan Amount |
|---|---|---|---|
| Open | Daniel Erica M | $181,000 | |
| Closed | Daniel Robert A | $194,800 |
Source: Public Records
Tax History
| Year | Tax Paid | Tax Assessment Tax Assessment Total Assessment is a certain percentage of the fair market value that is determined by local assessors to be the total taxable value of land and additions on the property. | Land | Improvement |
|---|---|---|---|---|
| 2025 | $5,405 | $411,179 | $137,362 | $273,817 |
| 2024 | $5,405 | $403,118 | $134,669 | $268,449 |
| 2023 | $5,269 | $395,215 | $132,029 | $263,186 |
| 2022 | $5,208 | $387,467 | $129,441 | $258,026 |
| 2021 | $5,134 | $379,870 | $126,903 | $252,967 |
| 2020 | $4,840 | $375,976 | $125,602 | $250,374 |
| 2019 | $4,227 | $368,605 | $123,140 | $245,465 |
| 2018 | $4,138 | $361,378 | $120,726 | $240,652 |
| 2017 | $4,078 | $354,293 | $118,359 | $235,934 |
| 2016 | $3,943 | $347,347 | $116,039 | $231,308 |
| 2015 | $3,915 | $342,130 | $114,296 | $227,834 |
| 2014 | $3,835 | $335,430 | $112,058 | $223,372 |
Source: Public Records
Map
Nearby Homes
- 1894 Wedgemere Rd
- 1676 Vann Ct
- 1280 W Main St Unit 6
- 1280 W Main St Unit 15
- 302 Travelodge Dr
- 520 N Cuyamaca St
- 528 N Cuyamaca St
- 377 El Monte Rd
- 503 N Cuyamaca St
- 274 S Pierce St Unit 17
- 1958 Milford Place
- 1387 Weers St
- 1234 El Mio Dr
- 6110 Amaya Dr
- 652 La Sombra Dr
- 933 Eastside Rd
- 874 Hacienda Dr
- 927 W Main St
- 6130 Howell Dr
- 6050 Henderson Dr Unit 9
- 1677 View Way
- 1647 View Way
- 203 N Westwind Dr
- 1654 View Way
- 1676 Berenda Place
- 1678 View Way
- 1695 View Way
- 1658 Berenda Place
- 227 N Westwind Dr
- 1633 View Way
- 1696 View Way
- 1632 Berenda Place
- 1630 View Way
- 1703 View Way
- 375 Mount Hills Place
- 393 Mount Hills Place
- 1619 View Way
- 245 N Westwind Dr
- 1610 Berenda Place
- 1647 Berenda Place
Your Personal Tour Guide
Ask me questions while you tour the home.