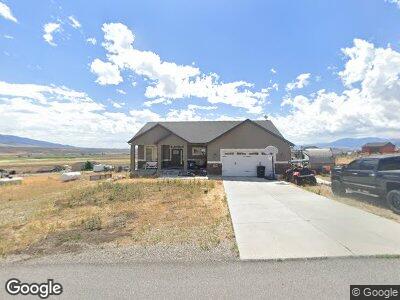
1661 W Ridgeline Rd Stockton, UT 84071
Estimated Value: $597,000 - $670,000
--
Bed
--
Bath
3,227
Sq Ft
$196/Sq Ft
Est. Value
About This Home
This home is located at 1661 W Ridgeline Rd, Stockton, UT 84071 and is currently estimated at $631,773, approximately $195 per square foot. 1661 W Ridgeline Rd is a home with nearby schools including Settlement Canyon Elementary School and Dugway.
Ownership History
Date
Name
Owned For
Owner Type
Purchase Details
Closed on
Aug 10, 2021
Sold by
Rael Stevie and Rael Ronica
Bought by
Rael Ronica and Rael Stevie
Current Estimated Value
Home Financials for this Owner
Home Financials are based on the most recent Mortgage that was taken out on this home.
Original Mortgage
$394,790
Outstanding Balance
$364,364
Interest Rate
2.9%
Mortgage Type
FHA
Estimated Equity
$263,794
Purchase Details
Closed on
Sep 17, 2019
Sold by
Rael Ronica and Rael Stevie
Bought by
Rael Stevie and Rael Ronica
Home Financials for this Owner
Home Financials are based on the most recent Mortgage that was taken out on this home.
Original Mortgage
$273,600
Interest Rate
3.6%
Mortgage Type
New Conventional
Purchase Details
Closed on
Sep 27, 2016
Sold by
L & B Development Company Inc
Bought by
New Pride Builders Llc
Home Financials for this Owner
Home Financials are based on the most recent Mortgage that was taken out on this home.
Original Mortgage
$209,000
Interest Rate
3.43%
Mortgage Type
Construction
Create a Home Valuation Report for This Property
The Home Valuation Report is an in-depth analysis detailing your home's value as well as a comparison with similar homes in the area
Home Values in the Area
Average Home Value in this Area
Purchase History
| Date | Buyer | Sale Price | Title Company |
|---|---|---|---|
| Rael Ronica | -- | Truly Title Inc Utah | |
| Rael Stevie | -- | Oasis Title Llc | |
| New Pride Builders Llc | -- | Security Title Insurance Age |
Source: Public Records
Mortgage History
| Date | Status | Borrower | Loan Amount |
|---|---|---|---|
| Open | Rael Ronica | $394,790 | |
| Closed | Rael Stevie | $273,600 | |
| Closed | New Pride Builders Llc | $209,000 |
Source: Public Records
Tax History Compared to Growth
Tax History
| Year | Tax Paid | Tax Assessment Tax Assessment Total Assessment is a certain percentage of the fair market value that is determined by local assessors to be the total taxable value of land and additions on the property. | Land | Improvement |
|---|---|---|---|---|
| 2024 | $3,692 | $308,135 | $120,375 | $187,760 |
| 2023 | $3,692 | $293,430 | $120,375 | $173,055 |
| 2022 | $3,245 | $309,676 | $101,500 | $208,176 |
| 2021 | $2,595 | $205,062 | $44,500 | $160,562 |
| 2020 | $2,435 | $331,952 | $72,500 | $259,452 |
| 2019 | $2,069 | $275,610 | $50,000 | $225,610 |
| 2018 | $2,029 | $255,100 | $50,000 | $205,100 |
| 2017 | $1,817 | $245,333 | $50,000 | $195,333 |
| 2016 | $292 | $40,000 | $40,000 | $0 |
| 2015 | $292 | $22,500 | $0 | $0 |
| 2014 | -- | $22,500 | $0 | $0 |
Source: Public Records
Map
Nearby Homes
- 1843 W Big Sky Dr
- 2258 W Deer Run Dr Unit 174
- 2521 W Ridgeline Rd
- 3214 W Ridgeline Rd
- 25 W Pearson
- 282 S Sheridan St
- 305 S Sheridan St
- 93 N Sherman St
- 60 S Johnson St
- 609 E 900 S
- 0 E Bald Mountain Rd
- 0 Utah 36
- 475 Utah 36
- 1054 S 1050 W
- 1081 S 900 W
- 50 Pine St
- 799 3 O'Clock Dr
- 1018 S 810 W
- 765 1 O'Clock Dr
- 1082 Southland Dr
- 1661 W Ridgeline Rd
- 1621 W Ridgeline Rd
- 652 S Cactus Rose Unit 347
- 1695 W Ridgeline Rd
- 1664 W Big Sky Dr Unit 347
- 1692 W Big Sky Dr
- 603 S Cactus Rose Unit 376
- 625 S Cactus Rose Unit 202
- 1735 W Ridgeline Rd
- 1671 W Big Sky Dr
- 671 S Cactus Rose Unit 378
- 671 S Cactus Rose
- 1718 W Big Sky Dr
- 575 S Cactus Rose Unit 375
- 1572 W Ridgeline Rd Unit 394
- 1530 W Ridgeline Rd Unit 393
- 1711 W Big Sky Dr Unit 345
- 1711 W Big Sky Dr
- 1654 W Ridgeline Rd Unit 396
- 1612 W Ridgeline Rd Unit 395