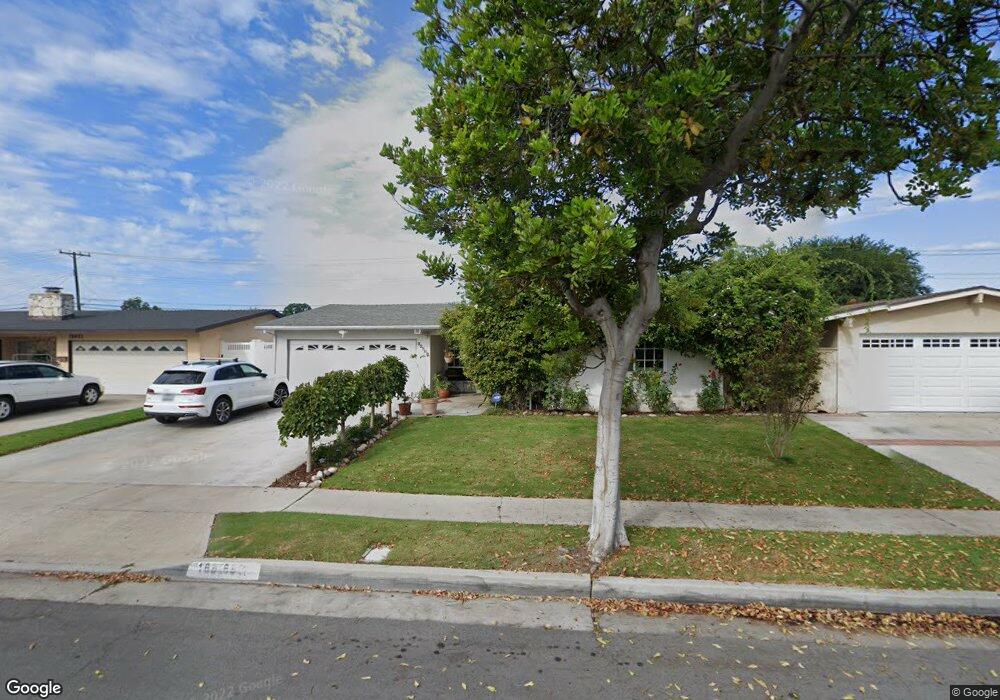
16611 Rhone Ln Huntington Beach, CA 92647
Estimated Value: $1,192,117 - $1,418,000
4
Beds
2
Baths
1,391
Sq Ft
$914/Sq Ft
Est. Value
About This Home
This home is located at 16611 Rhone Ln, Huntington Beach, CA 92647 and is currently estimated at $1,271,529, approximately $914 per square foot. 16611 Rhone Ln is a home located in Orange County with nearby schools including Sun View Elementary School, Spring View Middle School, and Ocean View High.
Ownership History
Date
Name
Owned For
Owner Type
Purchase Details
Closed on
Mar 24, 2023
Sold by
Shahidi Hooman K
Bought by
Hooman Khatib Shahidi And Nazanin Ghaffarizad
Current Estimated Value
Purchase Details
Closed on
Jun 29, 2018
Sold by
Shahidi Hooman K
Bought by
Shahidi Hooman K and Ghaffarizadeh Nazanin
Purchase Details
Closed on
Feb 20, 2015
Sold by
Shahidi Hooman K
Bought by
Shahidi Hooman K
Home Financials for this Owner
Home Financials are based on the most recent Mortgage that was taken out on this home.
Original Mortgage
$310,337
Interest Rate
3.6%
Mortgage Type
FHA
Purchase Details
Closed on
Aug 23, 2000
Sold by
Norris Harry E and Norris Clara M
Bought by
Shahidi Hooman K
Home Financials for this Owner
Home Financials are based on the most recent Mortgage that was taken out on this home.
Original Mortgage
$215,200
Interest Rate
8.13%
Create a Home Valuation Report for This Property
The Home Valuation Report is an in-depth analysis detailing your home's value as well as a comparison with similar homes in the area
Home Values in the Area
Average Home Value in this Area
Purchase History
| Date | Buyer | Sale Price | Title Company |
|---|---|---|---|
| Hooman Khatib Shahidi And Nazanin Ghaffarizad | -- | None Listed On Document | |
| Shahidi Hooman K | -- | None Available | |
| Shahidi Hooman K | -- | Title 365 | |
| Shahidi Hooman K | -- | Title 365 | |
| Shahidi Hooman K | $269,000 | Chicago Title Co |
Source: Public Records
Mortgage History
| Date | Status | Borrower | Loan Amount |
|---|---|---|---|
| Previous Owner | Shahidi Hooman K | $310,337 | |
| Previous Owner | Shahidi Hooman K | $215,200 |
Source: Public Records
Tax History Compared to Growth
Tax History
| Year | Tax Paid | Tax Assessment Tax Assessment Total Assessment is a certain percentage of the fair market value that is determined by local assessors to be the total taxable value of land and additions on the property. | Land | Improvement |
|---|---|---|---|---|
| 2025 | $4,667 | $405,331 | $298,418 | $106,913 |
| 2024 | $4,667 | $397,384 | $292,567 | $104,817 |
| 2023 | $4,558 | $389,593 | $286,831 | $102,762 |
| 2022 | $4,488 | $381,954 | $281,206 | $100,748 |
| 2021 | $4,406 | $374,465 | $275,692 | $98,773 |
| 2020 | $4,356 | $370,626 | $272,865 | $97,761 |
| 2019 | $4,281 | $363,359 | $267,514 | $95,845 |
| 2018 | $4,262 | $356,235 | $262,269 | $93,966 |
| 2017 | $4,195 | $349,250 | $257,126 | $92,124 |
| 2016 | $4,027 | $342,402 | $252,084 | $90,318 |
| 2015 | $3,966 | $337,259 | $248,297 | $88,962 |
| 2014 | $3,888 | $330,653 | $243,433 | $87,220 |
Source: Public Records
Map
Nearby Homes
- 16542 Sabot Ln
- 7901 Rhine Dr
- 16637 Viewpoint Ln Unit 12D
- 16531 Sabot Ln
- 16381 Magellan Ln
- 16401 Serenade Ln
- 7252 Elk Cir
- 16962 Westwood Ln Unit 14
- 16722 Goldenwest St
- 17091 Oak Ln
- 7002 Valentine Dr
- 7223 Alchemy Cir
- 7252 Ellington Dr
- 7231 Alchemy Cir
- 7248 Aura Cir
- 7264 Aura Cir
- 7272 Ellington Dr
- 16782 Heritage Ln
- 17261 Gothard St Unit 50
- 17261 Gothard St Unit 67