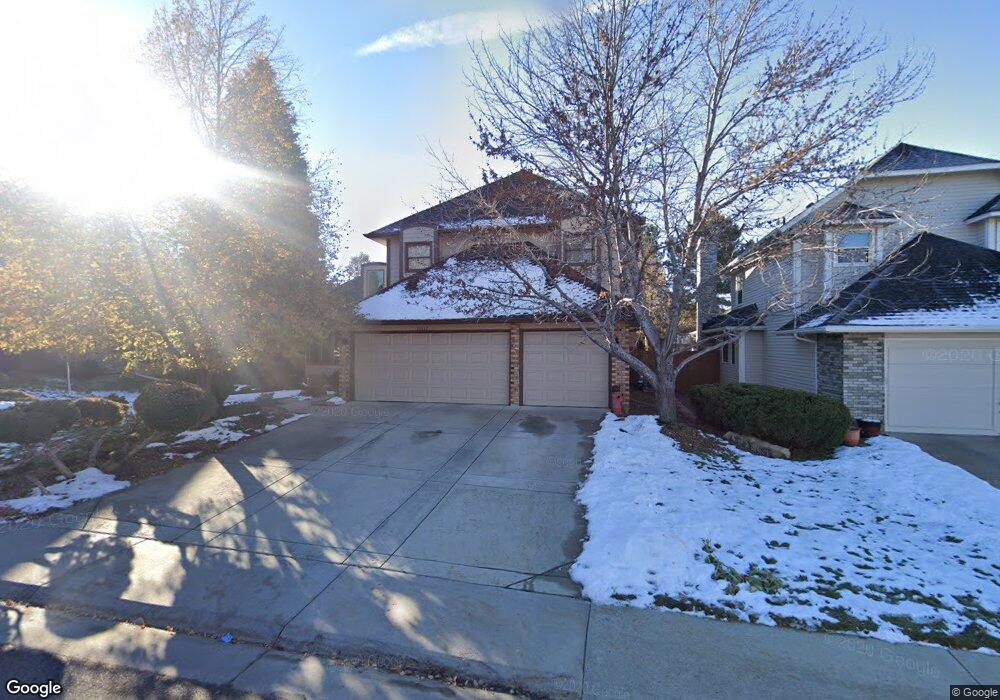
16612 E Prentice Cir Centennial, CO 80015
Piney Creek NeighborhoodEstimated Value: $607,953 - $673,000
4
Beds
4
Baths
2,572
Sq Ft
$251/Sq Ft
Est. Value
About This Home
This home is located at 16612 E Prentice Cir, Centennial, CO 80015 and is currently estimated at $645,738, approximately $251 per square foot. 16612 E Prentice Cir is a home located in Arapahoe County with nearby schools including Indian Ridge Elementary School, Laredo Middle School, and Smoky Hill High School.
Ownership History
Date
Name
Owned For
Owner Type
Purchase Details
Closed on
Jan 23, 1991
Sold by
Linn Mark Linn Mitzi
Bought by
Mceniry Matthew Sean and Mceniry Christine A
Current Estimated Value
Purchase Details
Closed on
Oct 30, 1989
Sold by
Gerry Richard F Gerry Susan M
Bought by
Linn Mark Linn Mitzi
Purchase Details
Closed on
Jun 9, 1987
Sold by
Conversion Arapco
Bought by
Gerry Richard F Gerry Susan M
Purchase Details
Closed on
Feb 1, 1985
Sold by
Conversion Arapco
Bought by
Conversion Arapco
Purchase Details
Closed on
Dec 1, 1983
Sold by
Conversion Arapco
Bought by
Conversion Arapco
Purchase Details
Closed on
Apr 1, 1983
Sold by
Conversion Arapco
Bought by
Conversion Arapco
Create a Home Valuation Report for This Property
The Home Valuation Report is an in-depth analysis detailing your home's value as well as a comparison with similar homes in the area
Home Values in the Area
Average Home Value in this Area
Purchase History
| Date | Buyer | Sale Price | Title Company |
|---|---|---|---|
| Mceniry Matthew Sean | -- | -- | |
| Linn Mark Linn Mitzi | -- | -- | |
| Gerry Richard F Gerry Susan M | -- | -- | |
| Conversion Arapco | -- | -- | |
| Conversion Arapco | -- | -- | |
| Conversion Arapco | -- | -- |
Source: Public Records
Tax History
| Year | Tax Paid | Tax Assessment Tax Assessment Total Assessment is a certain percentage of the fair market value that is determined by local assessors to be the total taxable value of land and additions on the property. | Land | Improvement |
|---|---|---|---|---|
| 2025 | $3,522 | $38,675 | -- | -- |
| 2024 | $3,134 | $39,765 | -- | -- |
| 2023 | $3,134 | $39,765 | $0 | $0 |
| 2022 | $3,278 | $32,874 | $0 | $0 |
| 2021 | $3,290 | $32,874 | $0 | $0 |
| 2020 | $3,247 | $33,105 | $0 | $0 |
| 2019 | $3,133 | $33,105 | $0 | $0 |
| 2018 | $3,070 | $29,023 | $0 | $0 |
| 2017 | $3,018 | $29,023 | $0 | $0 |
| 2016 | $2,757 | $25,090 | $0 | $0 |
| 2015 | $2,662 | $25,090 | $0 | $0 |
| 2014 | -- | $20,019 | $0 | $0 |
| 2013 | -- | $20,340 | $0 | $0 |
Source: Public Records
Map
Nearby Homes
- 16484 E Prentice Ave
- 16453 E Prentice Ave
- 16395 E Crestline Place
- 5288 S Olathe Cir
- 17013 E Berry Place
- 5229 S Pagosa Way
- 5101 S Olathe Cir
- 16788 E Belleview Place
- 5134 S Ouray Ct
- 5752 S Ouray Ct
- 16224 E Belleview Dr
- 5151 S Laredo Ct
- 17452 E Progress Dr
- 5426 S Jasper Way
- 5378 S Sedalia Ct
- 16991 E Chenango Ave Unit A
- 16971 E Chenango Ave Unit A
- 16953 E Whitaker Dr Unit F
- 17544 E Powers Dr
- 17477 E Belleview Place
- 16590 E Prentice Cir
- 16632 E Prentice Cir
- 16570 E Prentice Cir
- 16652 E Prentice Cir
- 16611 E Prentice Cir
- 16631 E Prentice Cir
- 16579 E Prentice Cir
- 16651 E Prentice Cir
- 16550 E Prentice Cir
- 16591 E Crestline Place
- 16571 E Crestline Place
- 16603 E Crestline Place
- 16559 E Prentice Cir
- 16671 E Prentice Cir
- 16551 E Crestline Place
- 16530 E Prentice Cir
- 16633 E Crestline Place
- 16692 E Prentice Cir
- 16600 E Prentice Place
- 16630 E Prentice Place
Your Personal Tour Guide
Ask me questions while you tour the home.