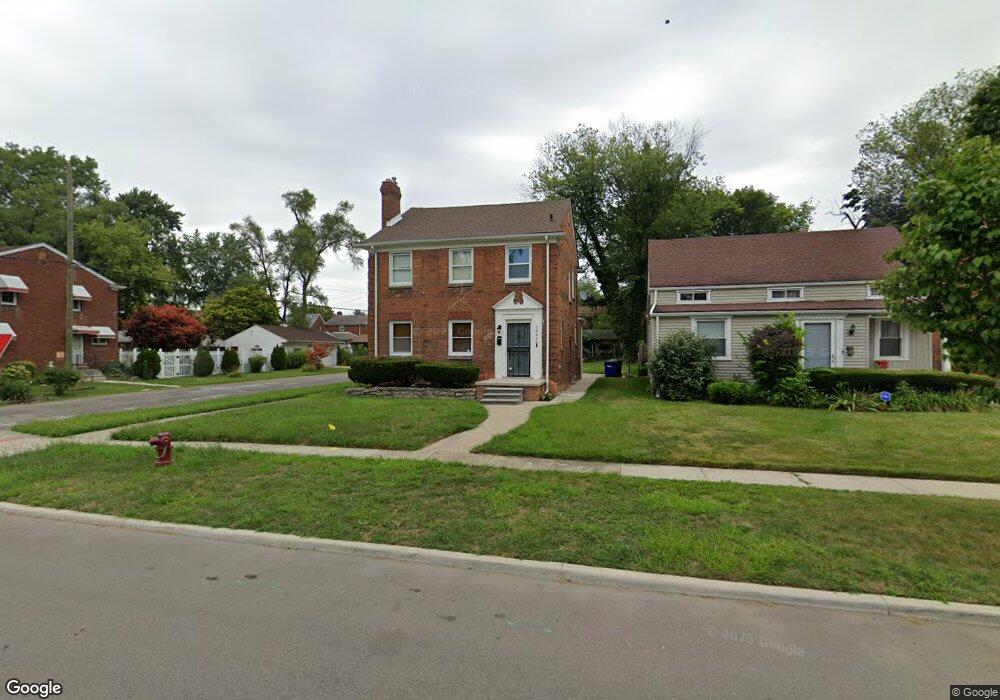
16616 Greenview Ave Unit Bldg-Unit Detroit, MI 48219
North Rosedale Park NeighborhoodEstimated Value: $228,000 - $251,645
--
Bed
2
Baths
1,686
Sq Ft
$142/Sq Ft
Est. Value
About This Home
This home is located at 16616 Greenview Ave Unit Bldg-Unit, Detroit, MI 48219 and is currently estimated at $239,911, approximately $142 per square foot. 16616 Greenview Ave Unit Bldg-Unit is a home located in Wayne County with nearby schools including Cooke STEM Academy, Ralph W. Emerson Elementary-Middle School, and Charles L. Spain Elementary-Middle School.
Ownership History
Date
Name
Owned For
Owner Type
Purchase Details
Closed on
Oct 17, 2019
Sold by
Goff Elizabeth and Wade Christopher
Bought by
Gibbons Samuel and Taylor Gibbons Melissa
Current Estimated Value
Purchase Details
Closed on
Dec 21, 2017
Sold by
Xiong Beili
Bought by
Goff Elizabeth
Purchase Details
Closed on
May 14, 2014
Sold by
Pom Investors Llc
Bought by
Xiong Beili
Purchase Details
Closed on
Jan 10, 2014
Sold by
Naples Properties Llc
Bought by
Pom Investors Llc
Purchase Details
Closed on
Nov 29, 2010
Sold by
Wojtowicz Raymond J
Bought by
Naples Properties Llc
Purchase Details
Closed on
Oct 11, 2007
Sold by
Army Marcus
Bought by
Rkbj Walker Llc
Purchase Details
Closed on
Sep 18, 2006
Sold by
Doyle Dan
Bought by
Army Marcus L
Create a Home Valuation Report for This Property
The Home Valuation Report is an in-depth analysis detailing your home's value as well as a comparison with similar homes in the area
Home Values in the Area
Average Home Value in this Area
Purchase History
| Date | Buyer | Sale Price | Title Company |
|---|---|---|---|
| Gibbons Samuel | $146,000 | Regions Title Agency Llc | |
| Goff Elizabeth | $32,000 | None Available | |
| Xiong Beili | $45,000 | Embassy Title Agency Inc | |
| Pom Investors Llc | $5,000 | None Available | |
| Naples Properties Llc | $10,551 | None Available | |
| Rkbj Walker Llc | $48,473 | None Available | |
| Army Marcus L | $500 | None Available |
Source: Public Records
Tax History Compared to Growth
Tax History
| Year | Tax Paid | Tax Assessment Tax Assessment Total Assessment is a certain percentage of the fair market value that is determined by local assessors to be the total taxable value of land and additions on the property. | Land | Improvement |
|---|---|---|---|---|
| 2025 | $6,784 | $108,900 | $0 | $0 |
| 2024 | $6,784 | $103,400 | $0 | $0 |
| 2023 | $6,599 | $82,600 | $0 | $0 |
| 2022 | $3,242 | $51,800 | $0 | $0 |
| 2021 | $2,949 | $33,000 | $0 | $0 |
| 2020 | $2,392 | $30,600 | $0 | $0 |
| 2019 | $2,143 | $23,700 | $0 | $0 |
| 2018 | $1,857 | $21,000 | $0 | $0 |
| 2017 | $368 | $19,400 | $0 | $0 |
| 2016 | $2,251 | $26,600 | $0 | $0 |
| 2015 | $2,660 | $26,600 | $0 | $0 |
| 2013 | $3,693 | $36,928 | $0 | $0 |
| 2010 | -- | $51,255 | $1,292 | $49,963 |
Source: Public Records
Map
Nearby Homes
- 16526 Avon Ave
- 16550 Stahelin Ave
- 16740 Stahelin Ave
- 16842 Greenview Ave
- 16614 Sunderland Rd
- 16718 Sunderland Rd
- 16156 Glastonbury Rd
- 16810 Stahelin Ave
- 16217 Greenview Ave
- 16209 Stahelin Ave
- 17126 Stahelin Ave
- 16718 Fenmore St
- 15874 Ashton Rd
- 16828 Fenmore St
- 16870 Shaftsbury Ave
- 9161 W Outer Dr
- 9355 W Outer Dr
- 19209 Bretton Dr
- 15778 Southfield Fwy
- 9531 W Outer Dr
- 16616 Greenview Ave
- 16606 Greenview Ave
- 16606 Greenview Ave
- 16600 Greenview Ave
- 16700 Greenview Ave
- 16590 Greenview Ave
- 16582 Greenview Ave
- 16708 Greenview Ave
- 16708 Greenview Ave
- 16615 Glastonbury Rd
- 16605 Glastonbury Rd
- 16595 Glastonbury Rd
- 16705 Glastonbury Rd
- 16714 Greenview Ave
- 16714 Greenview Ave
- 16615 Greenview Ave
- 16609 Greenview Ave
- 16572 Greenview Ave
- 16589 Glastonbury Rd
- 16709 Glastonbury Rd