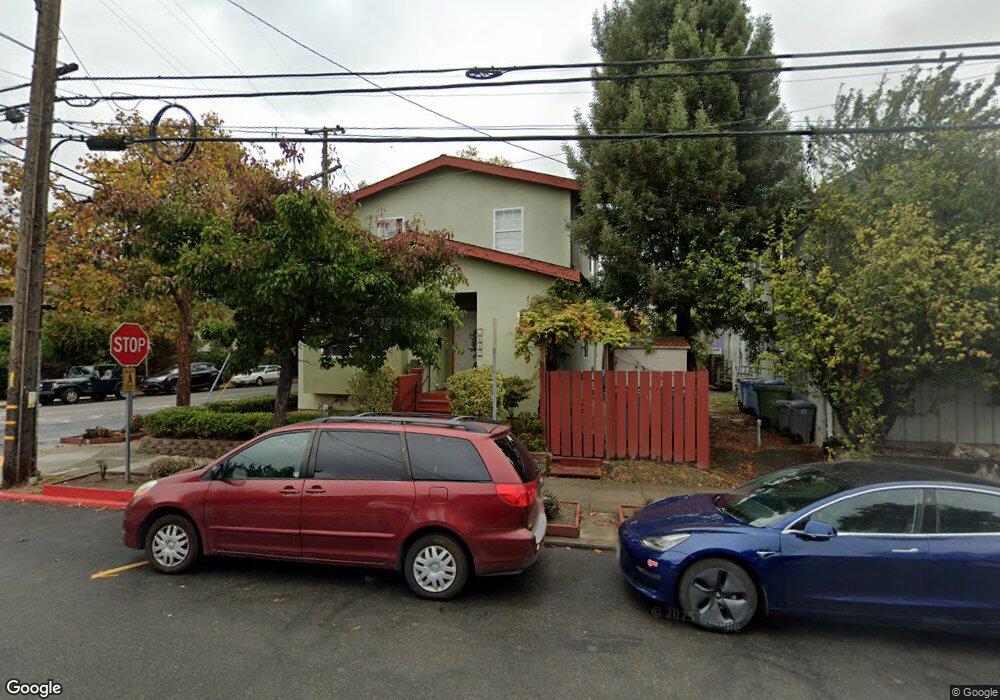
1662 Russell St Berkeley, CA 94703
South Berkeley NeighborhoodEstimated Value: $1,091,000 - $1,372,000
3
Beds
3
Baths
1,703
Sq Ft
$748/Sq Ft
Est. Value
About This Home
This home is located at 1662 Russell St, Berkeley, CA 94703 and is currently estimated at $1,274,101, approximately $748 per square foot. 1662 Russell St is a home located in Alameda County with nearby schools including Malcolm X Elementary School, Emerson Elementary School, and John Muir Elementary School.
Ownership History
Date
Name
Owned For
Owner Type
Purchase Details
Closed on
Aug 23, 2022
Sold by
Mallik Chandralekha
Bought by
Gurguri Trust
Current Estimated Value
Purchase Details
Closed on
Feb 18, 2022
Sold by
Chandralekha Mallik
Bought by
Mallik Balark and Mallik Sutapa Roy
Home Financials for this Owner
Home Financials are based on the most recent Mortgage that was taken out on this home.
Original Mortgage
$622,000
Interest Rate
3.92%
Mortgage Type
New Conventional
Purchase Details
Closed on
Mar 31, 2016
Sold by
Balark Mallik Chandralekha and Balark Mallik
Bought by
Balark Mallik Chandralekha and Balark Mallik
Purchase Details
Closed on
Apr 9, 2014
Sold by
Mandal Amal
Bought by
Mallik Chandralekha
Purchase Details
Closed on
Jul 29, 2010
Sold by
Mallik Chandralekha and Mallik Chandralakha
Bought by
Mallik Chandralekha and Mandal Amal
Purchase Details
Closed on
Oct 19, 2009
Sold by
Chapman E Brian and Amos Chapman Theresa
Bought by
Mallik Chandralakha and Mandal Amal
Home Financials for this Owner
Home Financials are based on the most recent Mortgage that was taken out on this home.
Original Mortgage
$510,550
Interest Rate
5.05%
Mortgage Type
FHA
Purchase Details
Closed on
Oct 24, 2006
Sold by
Chapman E Brian and Amos Chapman Theresa
Bought by
Chapman E Brian and Amos Chapman Theresa
Home Financials for this Owner
Home Financials are based on the most recent Mortgage that was taken out on this home.
Original Mortgage
$440,000
Interest Rate
6.36%
Mortgage Type
New Conventional
Purchase Details
Closed on
Feb 14, 2005
Sold by
Chapman E Brian
Bought by
Chapman E Brian and Amos Chapman Theresa
Home Financials for this Owner
Home Financials are based on the most recent Mortgage that was taken out on this home.
Original Mortgage
$361,000
Interest Rate
5.79%
Mortgage Type
New Conventional
Purchase Details
Closed on
Jul 28, 2004
Sold by
Chapman E Brian
Bought by
Chapman E Brian and Chapman Theresa Amos
Purchase Details
Closed on
Sep 20, 2001
Sold by
Chapman Emerson L and Chapman Bettye L
Bought by
Chapman E Brian
Purchase Details
Closed on
Dec 19, 2000
Sold by
Chapman Emerson L and Chapman Bettye S
Bought by
Chapman E Brian
Purchase Details
Closed on
Aug 27, 1997
Sold by
Chapman Emerson L and Chapman Bettye L
Bought by
Sudduth Chapman Emerson L and Sudduth Chapman Bettye
Create a Home Valuation Report for This Property
The Home Valuation Report is an in-depth analysis detailing your home's value as well as a comparison with similar homes in the area
Home Values in the Area
Average Home Value in this Area
Purchase History
| Date | Buyer | Sale Price | Title Company |
|---|---|---|---|
| Gurguri Trust | -- | -- | |
| Bsm Family Trust | -- | -- | |
| Mallik Balark | -- | Members Title Company | |
| Balark Mallik Chandralekha | -- | None Available | |
| Mallik Chandralekha | -- | None Available | |
| Mallik Chandralekha | -- | None Available | |
| Mallik Chandralakha | $520,000 | Fidelity National Title Co | |
| Chapman E Brian | -- | Commonwealth Land Title | |
| Chapman E Brian | -- | Commonwealth Land Title | |
| Chapman E Brian | -- | -- | |
| Chapman E Brian | -- | -- | |
| Chapman E Brian | -- | -- | |
| Chapman E Brian | -- | -- | |
| Chapman Emerson L | -- | -- | |
| Sudduth Chapman Emerson L | -- | -- |
Source: Public Records
Mortgage History
| Date | Status | Borrower | Loan Amount |
|---|---|---|---|
| Previous Owner | Mallik Balark | $622,000 | |
| Previous Owner | Mallik Chandralakha | $510,550 | |
| Previous Owner | Chapman E Brian | $440,000 | |
| Previous Owner | Chapman E Brian | $361,000 |
Source: Public Records
Tax History
| Year | Tax Paid | Tax Assessment Tax Assessment Total Assessment is a certain percentage of the fair market value that is determined by local assessors to be the total taxable value of land and additions on the property. | Land | Improvement |
|---|---|---|---|---|
| 2025 | $14,098 | $920,864 | $278,359 | $649,505 |
| 2024 | $14,098 | $902,677 | $272,903 | $636,774 |
| 2023 | $13,805 | $891,841 | $267,552 | $624,289 |
| 2022 | $10,613 | $625,475 | $189,742 | $442,733 |
| 2021 | $10,624 | $613,078 | $186,023 | $434,055 |
| 2020 | $9,997 | $613,724 | $184,117 | $429,607 |
| 2019 | $9,542 | $601,691 | $180,507 | $421,184 |
| 2018 | $9,369 | $589,897 | $176,969 | $412,928 |
| 2017 | $9,039 | $578,333 | $173,500 | $404,833 |
| 2016 | $8,708 | $566,997 | $170,099 | $396,898 |
| 2015 | $8,585 | $558,484 | $167,545 | $390,939 |
| 2014 | $8,509 | $547,548 | $164,264 | $383,284 |
Source: Public Records
Map
Nearby Homes
- 2926 Ellis St
- 1646 Ashby Ave
- 1535 Julia St
- 1530 Stuart St
- 3110 California St
- 2701 Grant St
- 3114 California St
- 1507 Prince St
- 2790 Sacramento St
- 2922 Stanton St
- 2782 Sacramento St
- 2774 Sacramento St
- 2758 Sacramento St
- 2750 Sacramento St
- 3101 Sacramento St
- 1450 Ward St
- 1612 Carleton St
- 3138 California St
- 1515 Derby St
- 1612 Parker St
- 1656 Russell St Unit Upper
- 1656 Russell St
- 2906 King St
- 1652 Russell St
- 2910 King St
- 2912 King St
- 2905 King St
- 1648 Russell St Unit 1
- 1648 Russell St
- 1654 Russell St Unit Lower
- 2901 King St
- 1705 Russell St
- 1703 Russell St
- 2909 King St
- 1701 Russell St
- 2916 King St
- 1646 Russell St
- 2911 King St
- 1706 Russell St
- 1708 Russell St
Your Personal Tour Guide
Ask me questions while you tour the home.