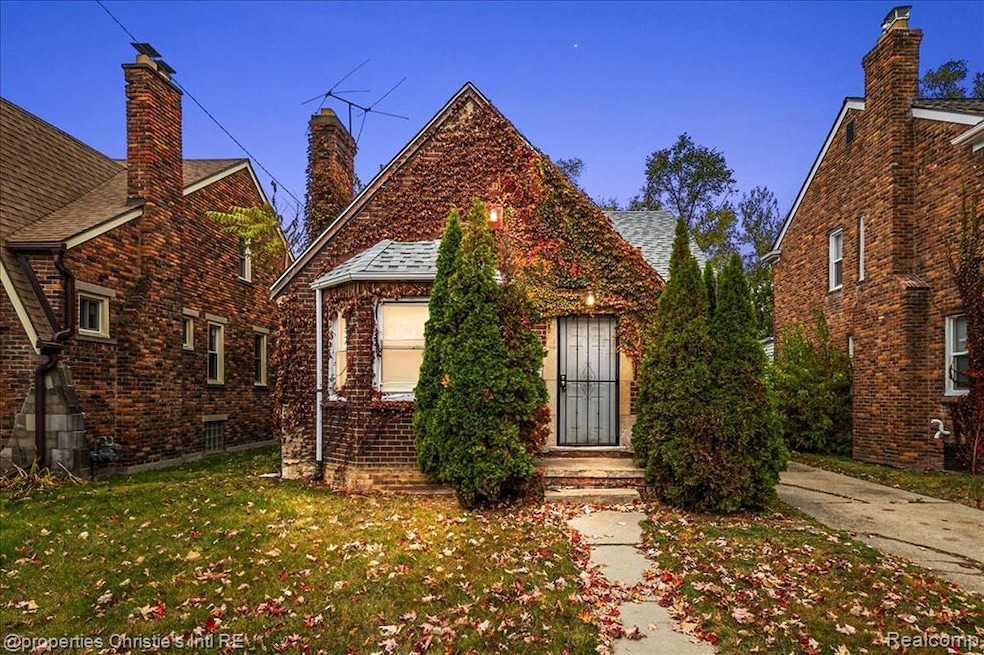
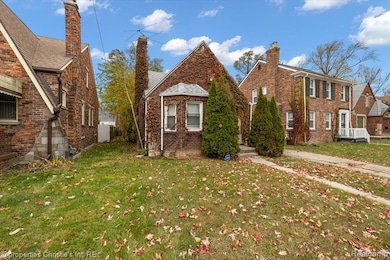
16621 Ardmore St Detroit, MI 48235
Hubbell-Puritan NeighborhoodEstimated payment $447/month
Highlights
- Ranch Style House
- No HOA
- Forced Air Heating System
- Cass Technical High School Rated 10
- 1 Car Detached Garage
About This Home
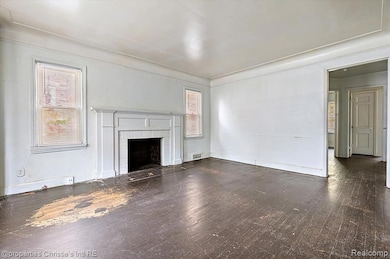
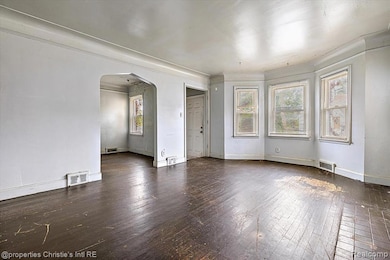
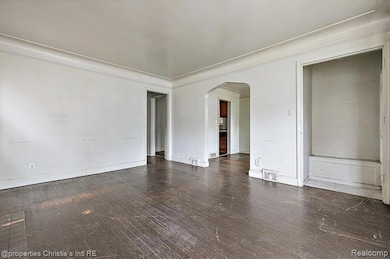
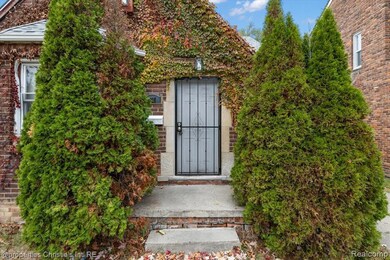
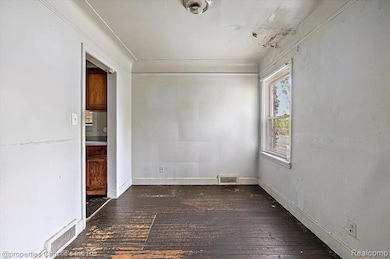
Charming Ranch very well maintained is now available! Walk into a spacious home, ready to move in! It's a great house with 3be/1 bath. Ideal for a family or as an excellent option for future rental. Don't miss this opportunity! Schedule your visit through showing time.
Listing Agent
@properties Christie's Int'l R.E. Detroit License #6501415490 Listed on: 11/06/2025

Home Details
Home Type
- Single Family
Est. Annual Taxes
- $1,055
Year Built
- Built in 1938
Lot Details
- 4,356 Sq Ft Lot
- Lot Dimensions are 40x110
Parking
- 1 Car Detached Garage
Home Design
- 825 Sq Ft Home
- Ranch Style House
- Brick Exterior Construction
- Block Foundation
Bedrooms and Bathrooms
- 2 Bedrooms
- 1 Full Bathroom
Location
- Ground Level
Utilities
- Forced Air Heating System
- Heating System Uses Natural Gas
- Sewer in Street
Additional Features
- Unfinished Basement
Community Details
- No Home Owners Association
- Heiden & Cunningham Palme R Grove Sub Subdivision
Listing and Financial Details
- Assessor Parcel Number W22I035138S
Map
Home Values in the Area
Average Home Value in this Area
Tax History
| Year | Tax Paid | Tax Assessment Tax Assessment Total Assessment is a certain percentage of the fair market value that is determined by local assessors to be the total taxable value of land and additions on the property. | Land | Improvement |
|---|---|---|---|---|
| 2025 | $1,039 | $27,400 | $0 | $0 |
| 2024 | $1,039 | $22,700 | $0 | $0 |
| 2023 | $1,008 | $18,500 | $0 | $0 |
| 2022 | $1,070 | $16,500 | $0 | $0 |
| 2021 | $1,043 | $12,800 | $0 | $0 |
| 2020 | $1,042 | $11,300 | $0 | $0 |
| 2019 | $1,028 | $8,900 | $0 | $0 |
| 2018 | $879 | $8,300 | $0 | $0 |
| 2017 | $124 | $8,100 | $0 | $0 |
| 2016 | $818 | $7,600 | $0 | $0 |
| 2015 | $760 | $7,600 | $0 | $0 |
| 2013 | $2,043 | $20,428 | $0 | $0 |
| 2010 | -- | $29,269 | $842 | $28,427 |
Property History
| Date | Event | Price | List to Sale | Price per Sq Ft |
|---|---|---|---|---|
| 11/20/2025 11/20/25 | For Sale | $68,000 | 0.0% | $82 / Sq Ft |
| 11/14/2025 11/14/25 | Pending | -- | -- | -- |
| 11/06/2025 11/06/25 | For Sale | $68,000 | -- | $82 / Sq Ft |
Purchase History
| Date | Type | Sale Price | Title Company |
|---|---|---|---|
| Warranty Deed | $57,960 | Regions Title Agency Llc | |
| Warranty Deed | $5,629 | Regions Title Agency Llc | |
| Land Contract | -- | None Available | |
| Foreclosure Deed | -- | None Available | |
| Warranty Deed | $21,900 | Regions Title Agency Llc | |
| Quit Claim Deed | -- | None Available | |
| Quit Claim Deed | $4,988 | None Available | |
| Sheriffs Deed | $66,300 | None Available |
Mortgage History
| Date | Status | Loan Amount | Loan Type |
|---|---|---|---|
| Closed | $0 | Seller Take Back |
Source: Realcomp
MLS Number: 20251052137
APN: 22-035138
Disclaimer: Certain information contained herein is derived from information provided by parties other than Homes.com. All information provided is deemed reliable, but is not guaranteed to be accurate and should be independently verified.
![]() IDX provided courtesy of Realcomp II Ltd. via Ten-X and MLS
IDX provided courtesy of Realcomp II Ltd. via Ten-X and MLS
Copyright 2025 Realcomp II Ltd. Shareholders
IDX information is provided exclusively for consumers' personal, noncommercial use and may not be used for any purpose other than to identify prospective properties consumers may be interested in purchasing. The accuracy of all information, regardless of source, is not guaranteed or warranted. All information should be independently verified.
Listing Information presented by local MLS brokerage: Ten-X, local REALTOR®- Arlene Richardson - (888)-952-6393
- 16636 Ardmore St
- 16611 Cruse St
- 16214 Cruse St
- 16246 Strathmoor St
- 16193 Cruse St
- 16893 Mark Twain St
- 16187 Cruse St
- 16183 Freeland St
- 16199 Stansbury St
- 16253 Strathmoor St
- 16510 Lesure St
- 16569 Tracey St
- 16172 Cruse St
- 16854 Lesure St
- 16259 Lesure St
- 16171 Mark Twain St
- 16150 Cruse St
- 16140 Mark Twain St
- 16134 Mark Twain St
- 16212 Lesure St
- 16540 Stansbury Ave
- 16847 Hubbell St
- 16851 Hubbell St
- 16540 Marlowe St
- 17147 Hartwell St Unit Turner properties
- 15800 Hubbell Ave
- 17376 Littlefield St Unit Upper Level
- 6720 W Outer Dr
- 18072 Hubbell Ave
- 16721 Greenfield Rd Unit 2
- 16721 Greenfield Rd
- 18089 Schaefer Hwy
- 16721 Greenfield #5 Rd
- 16701 Greenfield Rd
- 18040 Coyle St
- 15483 Ward Ave
- 15700 Greenfield Rd
- 15041 Cruse Unit#1 St
- 18293 Littlefield St
- 15818 Puritan St