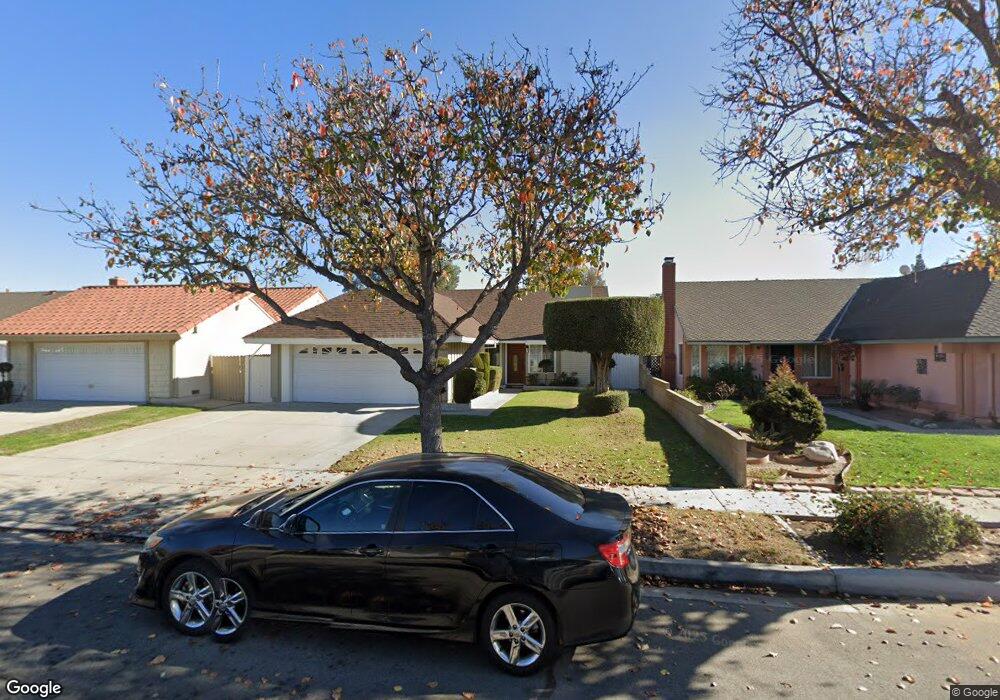
16628 Laurelbrook Way Cerritos, CA 90703
Estimated Value: $1,047,176 - $1,216,000
4
Beds
2
Baths
1,400
Sq Ft
$804/Sq Ft
Est. Value
About This Home
This home is located at 16628 Laurelbrook Way, Cerritos, CA 90703 and is currently estimated at $1,126,044, approximately $804 per square foot. 16628 Laurelbrook Way is a home located in Los Angeles County with nearby schools including Gonsalves Elementary School, Carmenita Middle School, and Cerritos High School.
Ownership History
Date
Name
Owned For
Owner Type
Purchase Details
Closed on
Dec 8, 2021
Sold by
Yon Kim Su
Bought by
Kim Joon Seok and Kim Su Yon
Current Estimated Value
Purchase Details
Closed on
May 5, 2006
Sold by
Kim Joon S and Kim Su Yon
Bought by
Kim Su Yon
Purchase Details
Closed on
Feb 26, 2002
Sold by
Lee Un Hong
Bought by
Kim Joon S
Home Financials for this Owner
Home Financials are based on the most recent Mortgage that was taken out on this home.
Original Mortgage
$145,000
Interest Rate
7.08%
Purchase Details
Closed on
Jun 25, 1999
Sold by
Trust Sun Bob C And Alice C Trs Sun Fami
Bought by
Lee Un Hong
Home Financials for this Owner
Home Financials are based on the most recent Mortgage that was taken out on this home.
Original Mortgage
$211,200
Interest Rate
7.64%
Mortgage Type
Stand Alone First
Purchase Details
Closed on
Jul 5, 1994
Sold by
Kang Sun Chien and Huang Sun Chi
Bought by
Sun Bob Chien Kang
Create a Home Valuation Report for This Property
The Home Valuation Report is an in-depth analysis detailing your home's value as well as a comparison with similar homes in the area
Home Values in the Area
Average Home Value in this Area
Purchase History
| Date | Buyer | Sale Price | Title Company |
|---|---|---|---|
| Kim Joon Seok | -- | Accommodation/Courtesy Recordi | |
| Kim Su Yon | -- | None Available | |
| Kim Joon S | $365,000 | Ticor Title Insurance | |
| Lee Un Hong | $264,000 | Chicago Title Co | |
| Lee Un Hong | -- | Chicago Title Co | |
| Sun Bob Chien Kang | -- | -- |
Source: Public Records
Mortgage History
| Date | Status | Borrower | Loan Amount |
|---|---|---|---|
| Previous Owner | Kim Joon S | $145,000 | |
| Previous Owner | Lee Un Hong | $211,200 |
Source: Public Records
Tax History Compared to Growth
Tax History
| Year | Tax Paid | Tax Assessment Tax Assessment Total Assessment is a certain percentage of the fair market value that is determined by local assessors to be the total taxable value of land and additions on the property. | Land | Improvement |
|---|---|---|---|---|
| 2025 | $6,454 | $539,190 | $274,767 | $264,423 |
| 2024 | $6,454 | $528,619 | $269,380 | $259,239 |
| 2023 | $6,242 | $518,255 | $264,099 | $254,156 |
| 2022 | $6,145 | $508,094 | $258,921 | $249,173 |
| 2021 | $6,000 | $498,133 | $253,845 | $244,288 |
| 2019 | $5,859 | $483,361 | $246,317 | $237,044 |
| 2018 | $5,418 | $473,885 | $241,488 | $232,397 |
| 2016 | $5,200 | $455,485 | $232,111 | $223,374 |
| 2015 | $5,131 | $448,644 | $228,625 | $220,019 |
| 2014 | $5,026 | $439,857 | $224,147 | $215,710 |
Source: Public Records
Map
Nearby Homes
- 13548 Village Dr Unit A
- 13370 Holly Oak Cir
- 13010 Artesia Blvd
- 13210 Sutton St
- 18006 Point Conception Place
- 18517 Betty Way
- 13044 Hedda Ln
- 16308 Indian Creek Rd
- 16429 Westbrook Ln
- 16611 Shenandoah Ave
- 15312 Roper Ave
- 14629 Stage Rd
- 14519 Dinard Ave
- 14516 Maryton Ave
- 14346 Marilla Ave
- 12525 Semora St
- 14422 Valley View Ave
- 15112 Bechard Ave
- 7152 Caprice Cir
- 19118 Martha Ave
- 16632 Laurelbrook Way
- 16624 Laurelbrook Way
- 16702 Laurelbrook Way
- 16625 Gerritt Ave
- 16618 Laurelbrook Way
- 16631 Gerritt Ave
- 16621 Gerritt Ave
- 16701 Gerritt Ave
- 16706 Laurelbrook Way
- 16617 Gerritt Ave
- 16614 Laurelbrook Way
- 16629 Laurelbrook Way
- 16633 Laurelbrook Way
- 16625 Laurelbrook Way
- 16707 Gerritt Ave
- 16703 Laurelbrook Way
- 16619 Laurelbrook Way
- 16613 Gerritt Ave
- 16712 Laurelbrook Way
- 16608 Laurelbrook Way