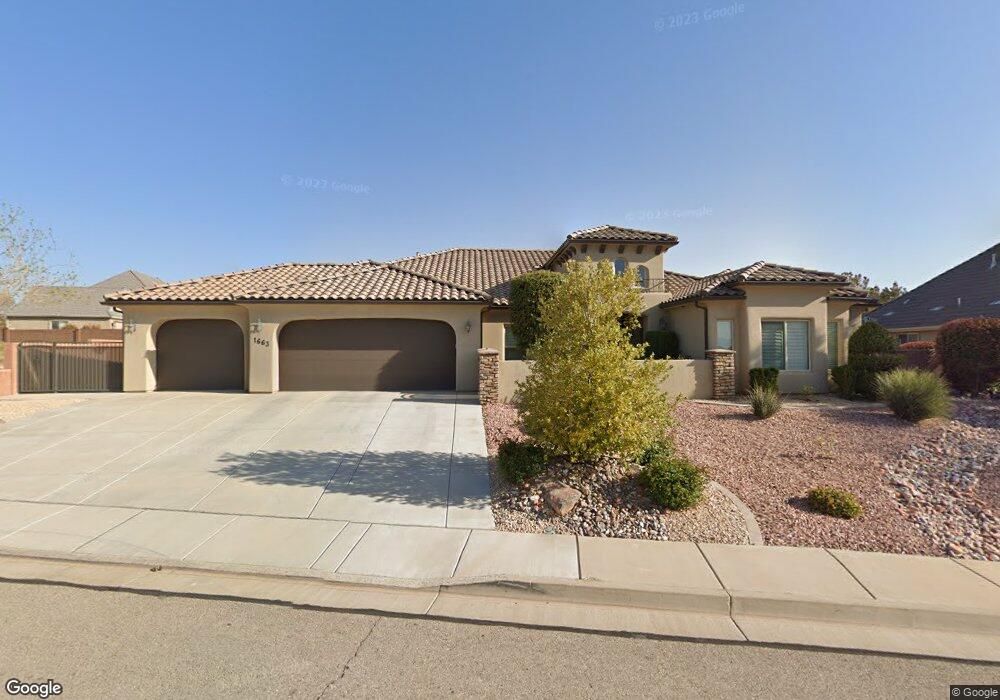
1663 E 180 S St. George, UT 84790
Estimated Value: $768,000 - $1,026,000
4
Beds
3
Baths
2,736
Sq Ft
$308/Sq Ft
Est. Value
About This Home
This home is located at 1663 E 180 S, St. George, UT 84790 and is currently estimated at $843,207, approximately $308 per square foot. 1663 E 180 S is a home located in Washington County with nearby schools including Heritage School, Dixie Middle School, and Tonaquint Intermediate School.
Ownership History
Date
Name
Owned For
Owner Type
Purchase Details
Closed on
Jun 29, 2022
Sold by
Maria Droste Narcisa
Bought by
Narcisa Maria Droste Revocable Trust
Current Estimated Value
Purchase Details
Closed on
Jun 15, 2022
Sold by
Maria Droste Narcisa
Bought by
Narcisa Maria Droste Revocable Trust
Purchase Details
Closed on
Jan 6, 2014
Sold by
Fj Allen Llc
Bought by
Dixie Dawn Investments Llc
Purchase Details
Closed on
Dec 18, 2013
Sold by
Hannig Douglas W
Bought by
Fj Allen Llc
Purchase Details
Closed on
Nov 30, 2012
Sold by
Hanning Warren L
Bought by
Hannig Douglas W
Purchase Details
Closed on
Mar 23, 2012
Sold by
The Day Family Limited Partnership
Bought by
Hannig Warren L and Warren L Hannig Revocable Trust
Purchase Details
Closed on
Jul 19, 2011
Sold by
Foremaster Ridge Development Llc
Bought by
The Day Family Limited Partnership
Create a Home Valuation Report for This Property
The Home Valuation Report is an in-depth analysis detailing your home's value as well as a comparison with similar homes in the area
Purchase History
| Date | Buyer | Sale Price | Title Company |
|---|---|---|---|
| Narcisa Maria Droste Revocable Trust | -- | None Listed On Document | |
| Narcisa Maria Droste Revocable Trust | -- | None Listed On Document | |
| Dixie Dawn Investments Llc | -- | Southern Utah Title | |
| Fj Allen Llc | -- | Southern Utah Title | |
| Hannig Douglas W | -- | Souther Utah Title Company | |
| Hannig Warren L | -- | Dixie Title Co | |
| The Day Family Limited Partnership | -- | Dixie Title Co |
Source: Public Records
Tax History
| Year | Tax Paid | Tax Assessment Tax Assessment Total Assessment is a certain percentage of the fair market value that is determined by local assessors to be the total taxable value of land and additions on the property. | Land | Improvement |
|---|---|---|---|---|
| 2025 | $2,688 | $402,270 | $115,500 | $286,770 |
| 2023 | $2,608 | $389,730 | $115,500 | $274,230 |
| 2022 | $3,371 | $388,465 | $112,750 | $275,715 |
| 2021 | $2,423 | $507,700 | $115,000 | $392,700 |
| 2020 | $2,261 | $446,200 | $115,000 | $331,200 |
| 2019 | $2,352 | $453,500 | $115,000 | $338,500 |
| 2018 | $2,268 | $225,775 | $0 | $0 |
| 2017 | $2,164 | $209,110 | $0 | $0 |
| 2016 | $2,143 | $191,510 | $0 | $0 |
| 2015 | $2,210 | $189,530 | $0 | $0 |
| 2014 | $985 | $85,000 | $0 | $0 |
Source: Public Records
Map
Nearby Homes
- 1646 E 90 Cir S
- 1684 E 290 S
- 86 S Acantilado Dr
- 0 Null Unit 26-269072
- 145 N Mall Dr Unit 57
- 145 N Mall Dr Unit 35
- 232 S Acantilado Cir
- 5394 S Aquamarine Ln
- 5409 S Aquamarine Ln
- 5398 S Aquamarine Ln
- 1226 W Cactus Wren Dr
- 5416 S Aquamarine Ln
- 149 N Eastridge Dr
- 1932 E 40 South Cir
- 301 S 1200 E Unit 47
- 301 S 1200 E Unit 31
- 301 S 1200 E Unit 16
- 301 S 1200 E Unit 52
- 301 S 1200 E Unit 91
- 201 S 2020 East Cir
- 180 180 St S
- 1677 E 180 S
- 1677 E 180 S Unit 447
- 1652 E 140 South Cir
- 1652 E 140 Cir S
- 1664 E 140 South Cir
- 1656 E 180 S
- 1674 E 180 S
- 156 S Crestline Dr
- 151 S Crestline Dr
- 0 N Foremaster Ridge
- 1699 E 180 S
- 1638 E 140 South Cir
- 1638 E 140 South Cir
- 199 S Eastridge Dr
- 171 S Eastridge Dr
- 197 S Eastridge Dr
- 1682 E 180 S
- 1751 E Ridgeline Cir
- 0 E 140 S Cir Lot Unit 21-221608
Your Personal Tour Guide
Ask me questions while you tour the home.