Estimated Value: $621,536 - $677,000
3
Beds
2
Baths
1,844
Sq Ft
$353/Sq Ft
Est. Value
About This Home
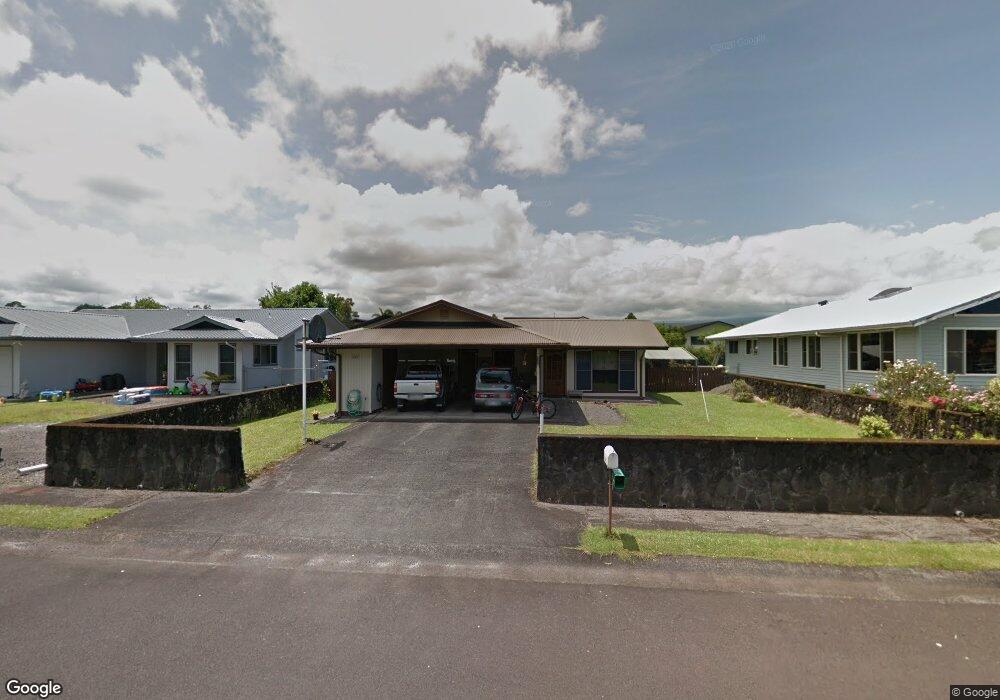
This home is located at 1663 Mona Loop, Hilo, HI 96720 and is currently estimated at $650,634, approximately $352 per square foot. 1663 Mona Loop is a home located in Hawaii County with nearby schools including Waiakeawaena Elementary School, Waiakea Intermediate School, and Waiakea High School.
Ownership History
Date
Name
Owned For
Owner Type
Purchase Details
Closed on
Dec 4, 2024
Sold by
Kang Stanley Lee and Kang Laura Mika
Bought by
Stanley L Kang Jr And Laura M Tsunehiro Kang and Kang
Current Estimated Value
Purchase Details
Closed on
Oct 22, 2024
Sold by
Tsunehiro Laura and Neal P Tsunehiro Revocable Living Trust
Bought by
Kang Laura Mika Tsunehi and Tsunehiro Laura
Purchase Details
Closed on
Oct 31, 2001
Sold by
Tsunehiro Neal Patrick and Tsunehiro Neal P
Bought by
Liv Tsunehiro Neal P and Neal P Tsunehiro Revocable Living Trust
Purchase Details
Closed on
Apr 24, 2000
Sold by
Tsunehiro Neal Patrick and Tsunehiro Gail Aiko
Bought by
Tsunehiro Neal Patrick and Tsunehiro Neal P
Purchase Details
Closed on
May 9, 1995
Sold by
Sandelin Kent D and Mcroberts Kasia L
Bought by
Tsunehiro Neal Patrick and Tsunehiro Gail Aiko
Create a Home Valuation Report for This Property
The Home Valuation Report is an in-depth analysis detailing your home's value as well as a comparison with similar homes in the area
Home Values in the Area
Average Home Value in this Area
Purchase History
| Date | Buyer | Sale Price | Title Company |
|---|---|---|---|
| Stanley L Kang Jr And Laura M Tsunehiro Kang | -- | None Listed On Document | |
| Stanley L Kang Jr And Laura M Tsunehiro Kang | -- | None Listed On Document | |
| Kang Stanley Lee | -- | None Listed On Document | |
| Kang Laura Mika Tsunehi | -- | None Listed On Document | |
| Liv Tsunehiro Neal P | -- | -- | |
| Tsunehiro Neal Patrick | -- | -- | |
| Tsunehiro Neal Patrick | $50,000 | -- |
Source: Public Records
Tax History
| Year | Tax Paid | Tax Assessment Tax Assessment Total Assessment is a certain percentage of the fair market value that is determined by local assessors to be the total taxable value of land and additions on the property. | Land | Improvement |
|---|---|---|---|---|
| 2025 | $929 | $565,400 | $211,800 | $353,600 |
| 2024 | $929 | $326,400 | $72,100 | $254,300 |
| 2023 | $913 | $316,900 | $72,100 | $244,800 |
| 2022 | $899 | $307,700 | $72,100 | $235,600 |
| 2021 | $855 | $298,700 | $72,100 | $226,600 |
| 2020 | $935 | $290,000 | $72,100 | $217,900 |
| 2019 | $894 | $281,600 | $72,100 | $209,500 |
| 2018 | $853 | $273,400 | $72,100 | $201,300 |
| 2017 | $814 | $265,400 | $72,100 | $193,300 |
| 2016 | $776 | $257,700 | $72,100 | $185,600 |
Source: Public Records
Map
Nearby Homes
- 845 Uilani Place
- 1588 Mailani St
- 723 W Kawailani St
- 595 W Kawailani St
- 1646 Oneawa Place
- 1088 Apono Place
- 450 Pohakulani St
- 508 Ekela St
- 337 Kapii Place
- 0 Ainalako Rd
- 110 Malia St
- 346 Kanoelani St
- 348 Keokolo Place
- 49 Kuhilani St
- 297 W Puainako St
- 39 Laula Rd
- 2668 Kuku St
- 347 Nohea St
- 250 Laula
- 20 Naniakea St
Your Personal Tour Guide
Ask me questions while you tour the home.