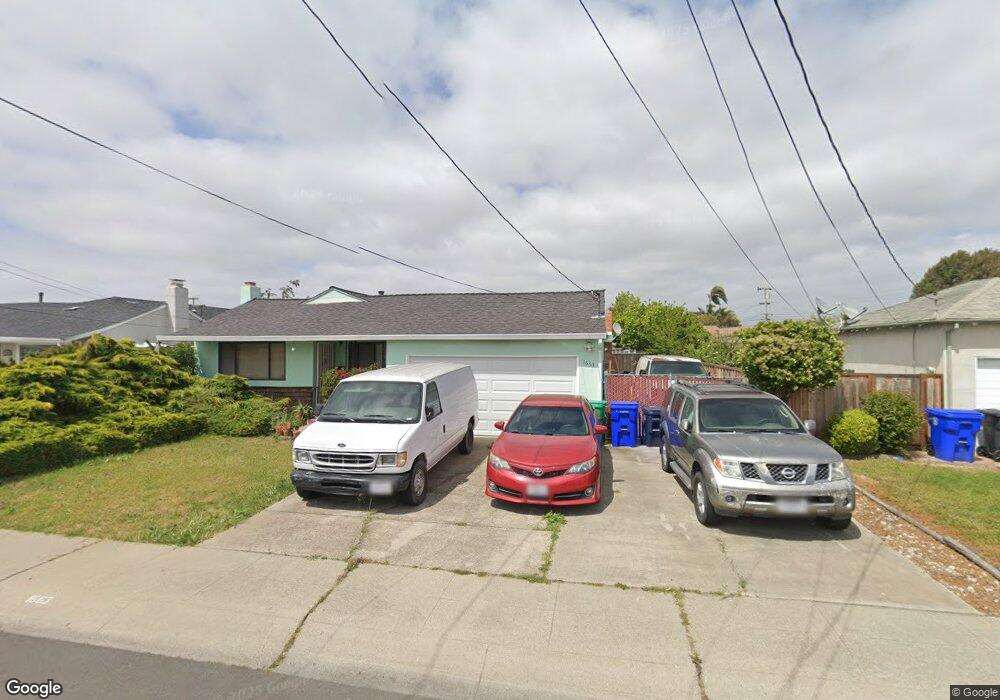
1663 Via Lucas San Lorenzo, CA 94580
Estimated Value: $796,000 - $946,000
3
Beds
2
Baths
1,492
Sq Ft
$584/Sq Ft
Est. Value
About This Home
This home is located at 1663 Via Lucas, San Lorenzo, CA 94580 and is currently estimated at $870,623, approximately $583 per square foot. 1663 Via Lucas is a home located in Alameda County with nearby schools including Bay Elementary School, Bohannon Middle School, and Arroyo High School.
Ownership History
Date
Name
Owned For
Owner Type
Purchase Details
Closed on
Dec 20, 2021
Sold by
Yeung Chi Ken
Bought by
Yeung Chi Ken and Chi Ken Yeung Trust
Current Estimated Value
Purchase Details
Closed on
Nov 18, 2002
Sold by
Sullins Jack R and Sullins Eileen O
Bought by
Yeung Chi Ken
Home Financials for this Owner
Home Financials are based on the most recent Mortgage that was taken out on this home.
Original Mortgage
$300,700
Outstanding Balance
$124,744
Interest Rate
5.89%
Estimated Equity
$745,879
Purchase Details
Closed on
Jan 18, 1995
Sold by
Gurr Dennis R
Bought by
Sullins Jack R and Sullins Eileen O
Home Financials for this Owner
Home Financials are based on the most recent Mortgage that was taken out on this home.
Original Mortgage
$185,250
Interest Rate
6.5%
Create a Home Valuation Report for This Property
The Home Valuation Report is an in-depth analysis detailing your home's value as well as a comparison with similar homes in the area
Home Values in the Area
Average Home Value in this Area
Purchase History
| Date | Buyer | Sale Price | Title Company |
|---|---|---|---|
| Yeung Chi Ken | -- | None Available | |
| Yeung Chi Ken | $393,000 | Fidelity National Title Co | |
| Sullins Jack R | $195,000 | Fidelity National Title |
Source: Public Records
Mortgage History
| Date | Status | Borrower | Loan Amount |
|---|---|---|---|
| Open | Yeung Chi Ken | $300,700 | |
| Previous Owner | Sullins Jack R | $185,250 | |
| Closed | Yeung Chi Ken | $52,800 |
Source: Public Records
Tax History
| Year | Tax Paid | Tax Assessment Tax Assessment Total Assessment is a certain percentage of the fair market value that is determined by local assessors to be the total taxable value of land and additions on the property. | Land | Improvement |
|---|---|---|---|---|
| 2025 | $7,417 | $568,852 | $170,742 | $398,110 |
| 2024 | $7,417 | $557,700 | $167,395 | $390,305 |
| 2023 | $7,380 | $546,769 | $164,114 | $382,655 |
| 2022 | $7,273 | $536,049 | $160,896 | $375,153 |
| 2021 | $7,076 | $525,542 | $157,743 | $367,799 |
| 2020 | $6,926 | $520,156 | $156,126 | $364,030 |
| 2019 | $6,938 | $509,960 | $153,066 | $356,894 |
| 2018 | $6,564 | $499,963 | $150,065 | $349,898 |
| 2017 | $6,265 | $490,162 | $147,123 | $343,039 |
| 2016 | $5,979 | $480,555 | $144,240 | $336,315 |
| 2015 | $5,850 | $473,339 | $142,074 | $331,265 |
| 2014 | $5,605 | $450,000 | $135,000 | $315,000 |
Source: Public Records
Map
Nearby Homes
- 1497 Via Manzanas
- 1603 Via Lacqua
- 1202 Via Lucas
- 15781 Via Teresa
- 17339 Via San Ardo
- 0 E 14th St Unit 41122018
- 16129 Via Pinale
- 1078 Via Enrico
- 16011 Via Conejo
- 1540 Sayre St
- 18005 Sunol Rd
- 15524 Montreal St
- 17999 Firestone Rd
- 15740 Paseo Del Campo
- 759 Woodgate Dr
- 18018 Sahara Rd
- 874 Lewelling Blvd
- 752 Woodgate Ct
- 17790 Via Arriba
- 2100 Lewelling Blvd Unit 60
- 1675 Via Lucas
- 1651 Via Lucas
- 16171 Via Sonora
- 16142 Lucas Ct
- 1687 Via Lucas
- 16201 Via Sonora
- 16163 Via Sonora
- 1670 Via Lucas
- 16134 Lucas Ct
- 1682 Via Lucas
- 1639 Via Lucas
- 16155 Via Sonora
- 16209 Via Sonora
- 1633 Lucas Ct
- 1694 Via Lucas
- 16200 Via Sonora
- 1709 Bockman Rd
- 16180 Via Sonora
- 16147 Via Sonora
- 16172 Via Sonora
Your Personal Tour Guide
Ask me questions while you tour the home.