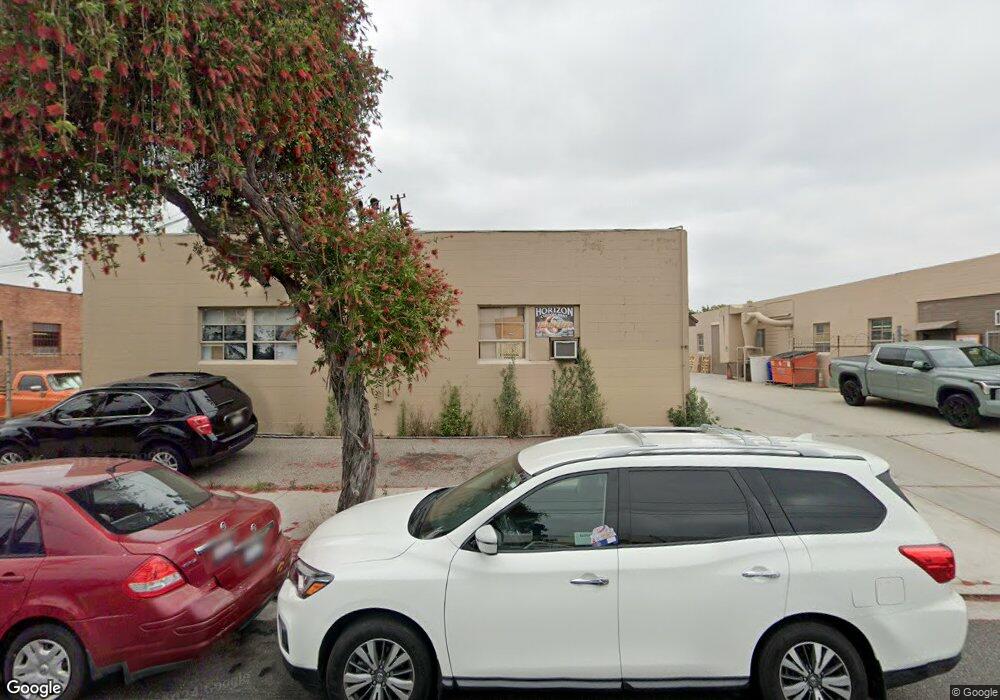
1663 W 134th St Gardena, CA 90249
Estimated Value: $1,819,814
--
Bed
--
Bath
26,210
Sq Ft
$69/Sq Ft
Est. Value
About This Home
This home is located at 1663 W 134th St, Gardena, CA 90249 and is currently estimated at $1,819,814, approximately $69 per square foot. 1663 W 134th St is a home located in Los Angeles County with nearby schools including Purche Avenue Elementary School, One Hundred Thirty-Fifth Street Elementary School, and Avalon Gardens Elementary School.
Ownership History
Date
Name
Owned For
Owner Type
Purchase Details
Closed on
Jun 12, 2025
Sold by
Hulse Carol A
Bought by
Frederick And Carol Hulse Family Trust and Hulse
Current Estimated Value
Purchase Details
Closed on
Mar 18, 2013
Sold by
Hulse Carol A
Bought by
Hulse Carol A
Purchase Details
Closed on
Jul 18, 2002
Sold by
Hulse Frederick G
Bought by
Hulse Frederick G and Hulse Carol A
Purchase Details
Closed on
Aug 7, 1997
Sold by
Ewals Helen N
Bought by
Hulse Frederick G and Hulse Carol A
Home Financials for this Owner
Home Financials are based on the most recent Mortgage that was taken out on this home.
Original Mortgage
$325,000
Interest Rate
7.43%
Mortgage Type
Commercial
Purchase Details
Closed on
Apr 21, 1995
Sold by
Ewals Helen N
Bought by
Ewals Helen N and The Helen N Ewals Family Trust
Create a Home Valuation Report for This Property
The Home Valuation Report is an in-depth analysis detailing your home's value as well as a comparison with similar homes in the area
Home Values in the Area
Average Home Value in this Area
Purchase History
| Date | Buyer | Sale Price | Title Company |
|---|---|---|---|
| Frederick And Carol Hulse Family Trust | -- | None Listed On Document | |
| Hulse Carol A | -- | None Available | |
| Hulse Frederick G | -- | -- | |
| Hulse Frederick G | -- | -- | |
| Hulse Frederick G | $325,000 | North American Title Co | |
| Ewals Helen N | -- | -- |
Source: Public Records
Mortgage History
| Date | Status | Borrower | Loan Amount |
|---|---|---|---|
| Previous Owner | Hulse Frederick G | $325,000 |
Source: Public Records
Tax History Compared to Growth
Tax History
| Year | Tax Paid | Tax Assessment Tax Assessment Total Assessment is a certain percentage of the fair market value that is determined by local assessors to be the total taxable value of land and additions on the property. | Land | Improvement |
|---|---|---|---|---|
| 2025 | $11,000 | $699,901 | $431,106 | $268,795 |
| 2024 | $11,000 | $686,178 | $422,653 | $263,525 |
| 2023 | $10,832 | $672,724 | $414,366 | $258,358 |
| 2022 | $10,397 | $659,535 | $406,242 | $253,293 |
| 2021 | $10,222 | $646,604 | $398,277 | $248,327 |
| 2020 | $10,268 | $639,975 | $394,194 | $245,781 |
| 2019 | $9,943 | $627,427 | $386,465 | $240,962 |
| 2018 | $9,043 | $615,126 | $378,888 | $236,238 |
| 2017 | $8,880 | $603,065 | $371,459 | $231,606 |
| 2016 | $8,478 | $591,241 | $364,176 | $227,065 |
| 2015 | $8,356 | $582,361 | $358,706 | $223,655 |
| 2014 | $8,446 | $570,954 | $351,680 | $219,274 |
Source: Public Records
Map
Nearby Homes
- 1618 W 132nd St Unit 17
- 1819 W 129th St
- 13204 S Wilton Place
- 1349 W 135th St Unit 21
- 13628 S Mariposa Ave
- 13919 S Normandie Ave Unit 20
- 1617 W 125th St
- 1261 139th St
- 1448 Azalea Cir
- 13707 S Budlong Ave Unit 118
- 13031 S Catalina Ave
- 13115 Spinning Ave
- 1736 W 144th St
- 1125 W 129th St
- 1425 W 145th St Unit 1
- 13709 Spinning Ave
- 1730 W 145th St Unit 9I
- 1239 W Rosecrans Ave
- 1239 W Rosecrans Ave Unit 31
- 1516 W 121st St
- 1630 W 132nd St
- 1600 W 132nd St
- 1542 W 134th St
- 1638 W 130th St
- 1650 W 130th St
- 13236 S Manhattan Place
- 13232 S Manhattan Place
- 13304 S Manhattan Place
- 13228 S Manhattan Place
- 13308 S Manhattan Place
- 13224 S Manhattan Place
- 13312 S Manhattan Place
- 13220 S Manhattan Place
- 13316 S Manhattan Place
- 13216 S Manhattan Place
- 13320 S Manhattan Place
- 13212 S Manhattan Place
- 13324 S Manhattan Place
- 13208 S Manhattan Place
- 14318 Claro Way