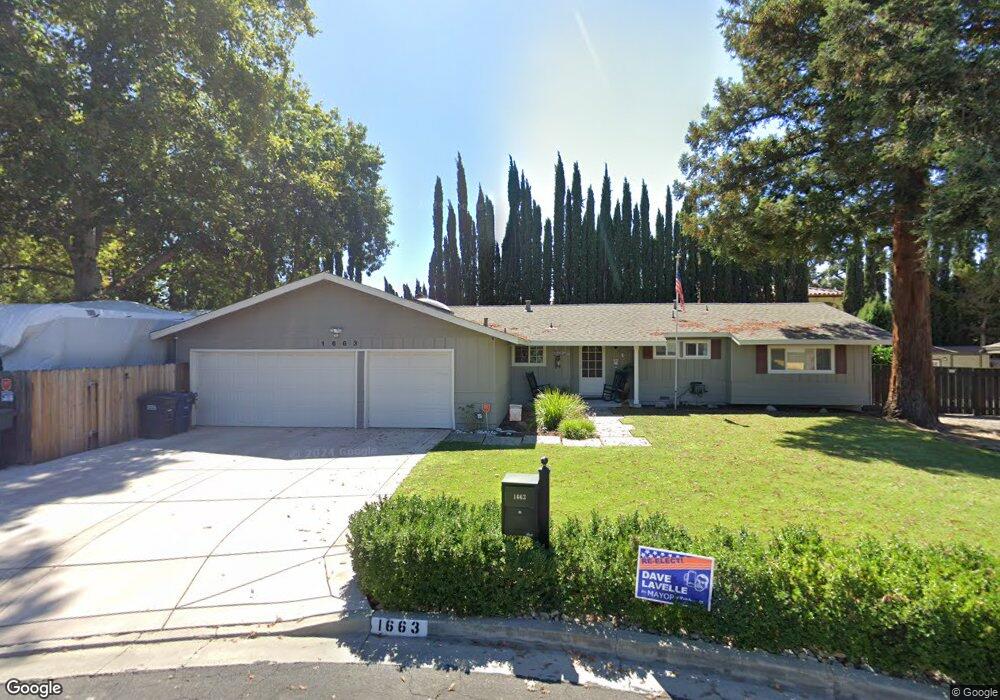
1663 Westchester Place Concord, CA 94519
Parkside NeighborhoodEstimated Value: $818,000 - $859,041
3
Beds
2
Baths
1,387
Sq Ft
$604/Sq Ft
Est. Value
About This Home
This home is located at 1663 Westchester Place, Concord, CA 94519 and is currently estimated at $838,260, approximately $604 per square foot. 1663 Westchester Place is a home located in Contra Costa County with nearby schools including Westwood Elementary School, El Dorado Middle School, and Concord High School.
Ownership History
Date
Name
Owned For
Owner Type
Purchase Details
Closed on
Dec 27, 2017
Sold by
Lavelle David D and Lavelle Tammy L
Bought by
Lavelle David Dean and Lavelle Tammy Lynn
Current Estimated Value
Purchase Details
Closed on
Oct 17, 2002
Sold by
Nixon James L
Bought by
Lavelle David D and Lavelle Tammy L
Home Financials for this Owner
Home Financials are based on the most recent Mortgage that was taken out on this home.
Original Mortgage
$372,000
Outstanding Balance
$154,018
Interest Rate
5.99%
Mortgage Type
Purchase Money Mortgage
Estimated Equity
$684,242
Purchase Details
Closed on
Apr 22, 1996
Sold by
Dunlap David A
Bought by
Nixon James L
Home Financials for this Owner
Home Financials are based on the most recent Mortgage that was taken out on this home.
Original Mortgage
$163,200
Interest Rate
7.84%
Mortgage Type
VA
Create a Home Valuation Report for This Property
The Home Valuation Report is an in-depth analysis detailing your home's value as well as a comparison with similar homes in the area
Home Values in the Area
Average Home Value in this Area
Purchase History
| Date | Buyer | Sale Price | Title Company |
|---|---|---|---|
| Lavelle David Dean | -- | None Available | |
| Lavelle David D | $465,000 | Financial Title | |
| Nixon James L | $160,000 | Commonwealth Land Title Co |
Source: Public Records
Mortgage History
| Date | Status | Borrower | Loan Amount |
|---|---|---|---|
| Open | Lavelle David D | $372,000 | |
| Previous Owner | Nixon James L | $163,200 | |
| Closed | Lavelle David D | $69,750 |
Source: Public Records
Tax History
| Year | Tax Paid | Tax Assessment Tax Assessment Total Assessment is a certain percentage of the fair market value that is determined by local assessors to be the total taxable value of land and additions on the property. | Land | Improvement |
|---|---|---|---|---|
| 2025 | $8,364 | $673,454 | $258,081 | $415,373 |
| 2024 | $8,151 | $660,250 | $253,021 | $407,229 |
| 2023 | $7,998 | $647,305 | $248,060 | $399,245 |
| 2022 | $7,892 | $634,614 | $243,197 | $391,417 |
| 2021 | $7,698 | $622,172 | $238,429 | $383,743 |
| 2019 | $7,551 | $603,720 | $231,358 | $372,362 |
| 2018 | $7,265 | $591,883 | $226,822 | $365,061 |
| 2017 | $6,580 | $540,000 | $206,940 | $333,060 |
| 2016 | $6,225 | $513,500 | $196,784 | $316,716 |
| 2015 | $5,589 | $455,000 | $174,366 | $280,634 |
| 2014 | $4,925 | $396,000 | $151,756 | $244,244 |
Source: Public Records
Map
Nearby Homes
- 1579 West St
- 1777 Clayton Way
- 1579 Farm Bureau Rd
- 3905 Clayton Rd Unit 37
- 1693 Greentree Dr
- 3745 Clayton Rd
- 4045 Sacramento St
- 3641 Clayton Rd Unit 34
- 0 Walnut Ave
- 4081 Clayton Rd Unit 201
- 3530 Kevin Place
- 1757 Eucalyptus Ct
- 3622 Delancey Ln
- 3479 Rose Ct
- 1449 Cape Cod Way
- 1760 Sharon Dr
- 1834 Venice Dr
- 3562 Kimball Way
- 1786 Sharon Dr
- 1730 Sapling Ct Unit A
- 1668 Westchester Place
- 1631 Latteri Ct
- 1673 Westchester Place
- 1656 Dorchester Place
- 1678 Westchester Place
- 1679 Westchester Place
- 1649 Georgia Dr
- 1684 Westchester Place
- 1669 Dorchester Place
- 1621 Latteri Ct
- 1634 Stillman Ct
- 1648 Georgia Dr
- 1662 Dorchester Place
- 1630 Franrose Ln
- 1681 Dorchester Place
- 1690 Westchester Place
- 1615 Latteri Ct
- 1630 Stillman Ct
- 1622 Franrose Ln
- 1691 Westchester Place
Your Personal Tour Guide
Ask me questions while you tour the home.